Alright, fellow testers, developers, and anyone who's ever stared without understanding at a loading spinner wondering, "Is it just me, or is this thing running super slowly?".
I'm back - your companion of Software Testing, and today, we’re tackling a really important challenge: Performance Testing.
Your app might work perfectly for one user, but what happens when a sudden surge of many users arrives? Will it stay strong or fall apart under pressure? That’s where Apache JMeter comes in - the free and open tool, built on Java, designed to test the limits of apps. Ready to find out whether your system is a strong bridge or just a shaky boat? Let’s dive into JMeter!
Why Do We Even Bother with Performance Testing?
Before we discover JMeter, let’s quickly cover why performance testing truly matters.
- User Experience: Slow is the new broken. Users expect speed - and if your app drags, they'll disappear. Simple as that. Performance testing keeps your users happy and loyal.
- Scalability: As your business grows, can your app handle the traffic? Performance testing helps you understand your limits and plan for the future.
- Stability: Does your app crash or buckle under pressure? Load testing reveals bottlenecks and weak points - before your users find them (and before it hurts).
- Finding Bottlenecks: JMeter helps you pinpoint exactly where things slow down - whether it’s the database, the application server, or a specific API call.
- Cost Savings: Understanding your app’s performance lets you optimize resources, avoiding unnecessary hardware or cloud costs.
Think about the opposite: the infamous "hug of death" - when a viral campaign or product launch overwhelms your app and makes it crashing down. Performance testing is your protection against that costly disaster.
Why JMeter? Our Open-Source Hero

So, why JMeter?
- It’s Free: Who doesn’t love a powerful, free tool? Being open-source means zero licensing costs - just download and go.
- Multi-Protocol Support: While it’s best known for web (HTTP/HTTPS) testing, JMeter can also tackle databases, FTP, LDAP, JMS, and more. (We’ll stick with HTTP for now - it’s the most common)
- Platform Independent: Built on Java, JMeter runs anywhere - Windows, macOS, Linux - anywhere Java does.
- Extensible: Thanks to a huge community, there’s a plugin for almost everything: new protocols, advanced reporting, you name it.
- GUI for Scripting, CLI for Running: JMeter offers a (pretty friendly!) graphical interface for building tests and a robust command-line mode for running massive loads efficiently.
JMeter gives you the power to simulate real-world user behavior, gather important performance data for automated test, and stress your app - all without breaking the bank.
→ Related guide: Burp Suite Tutorial
Getting Started: Firing Up the Load Generator
Ready to start trying things out yourself?
Step 1: Install Java
JMeter needs Java to run. Make sure you have a recent version (Java 8 or higher is usually recommended). You can download it from the Oracle website or use an OpenJDK distribution.
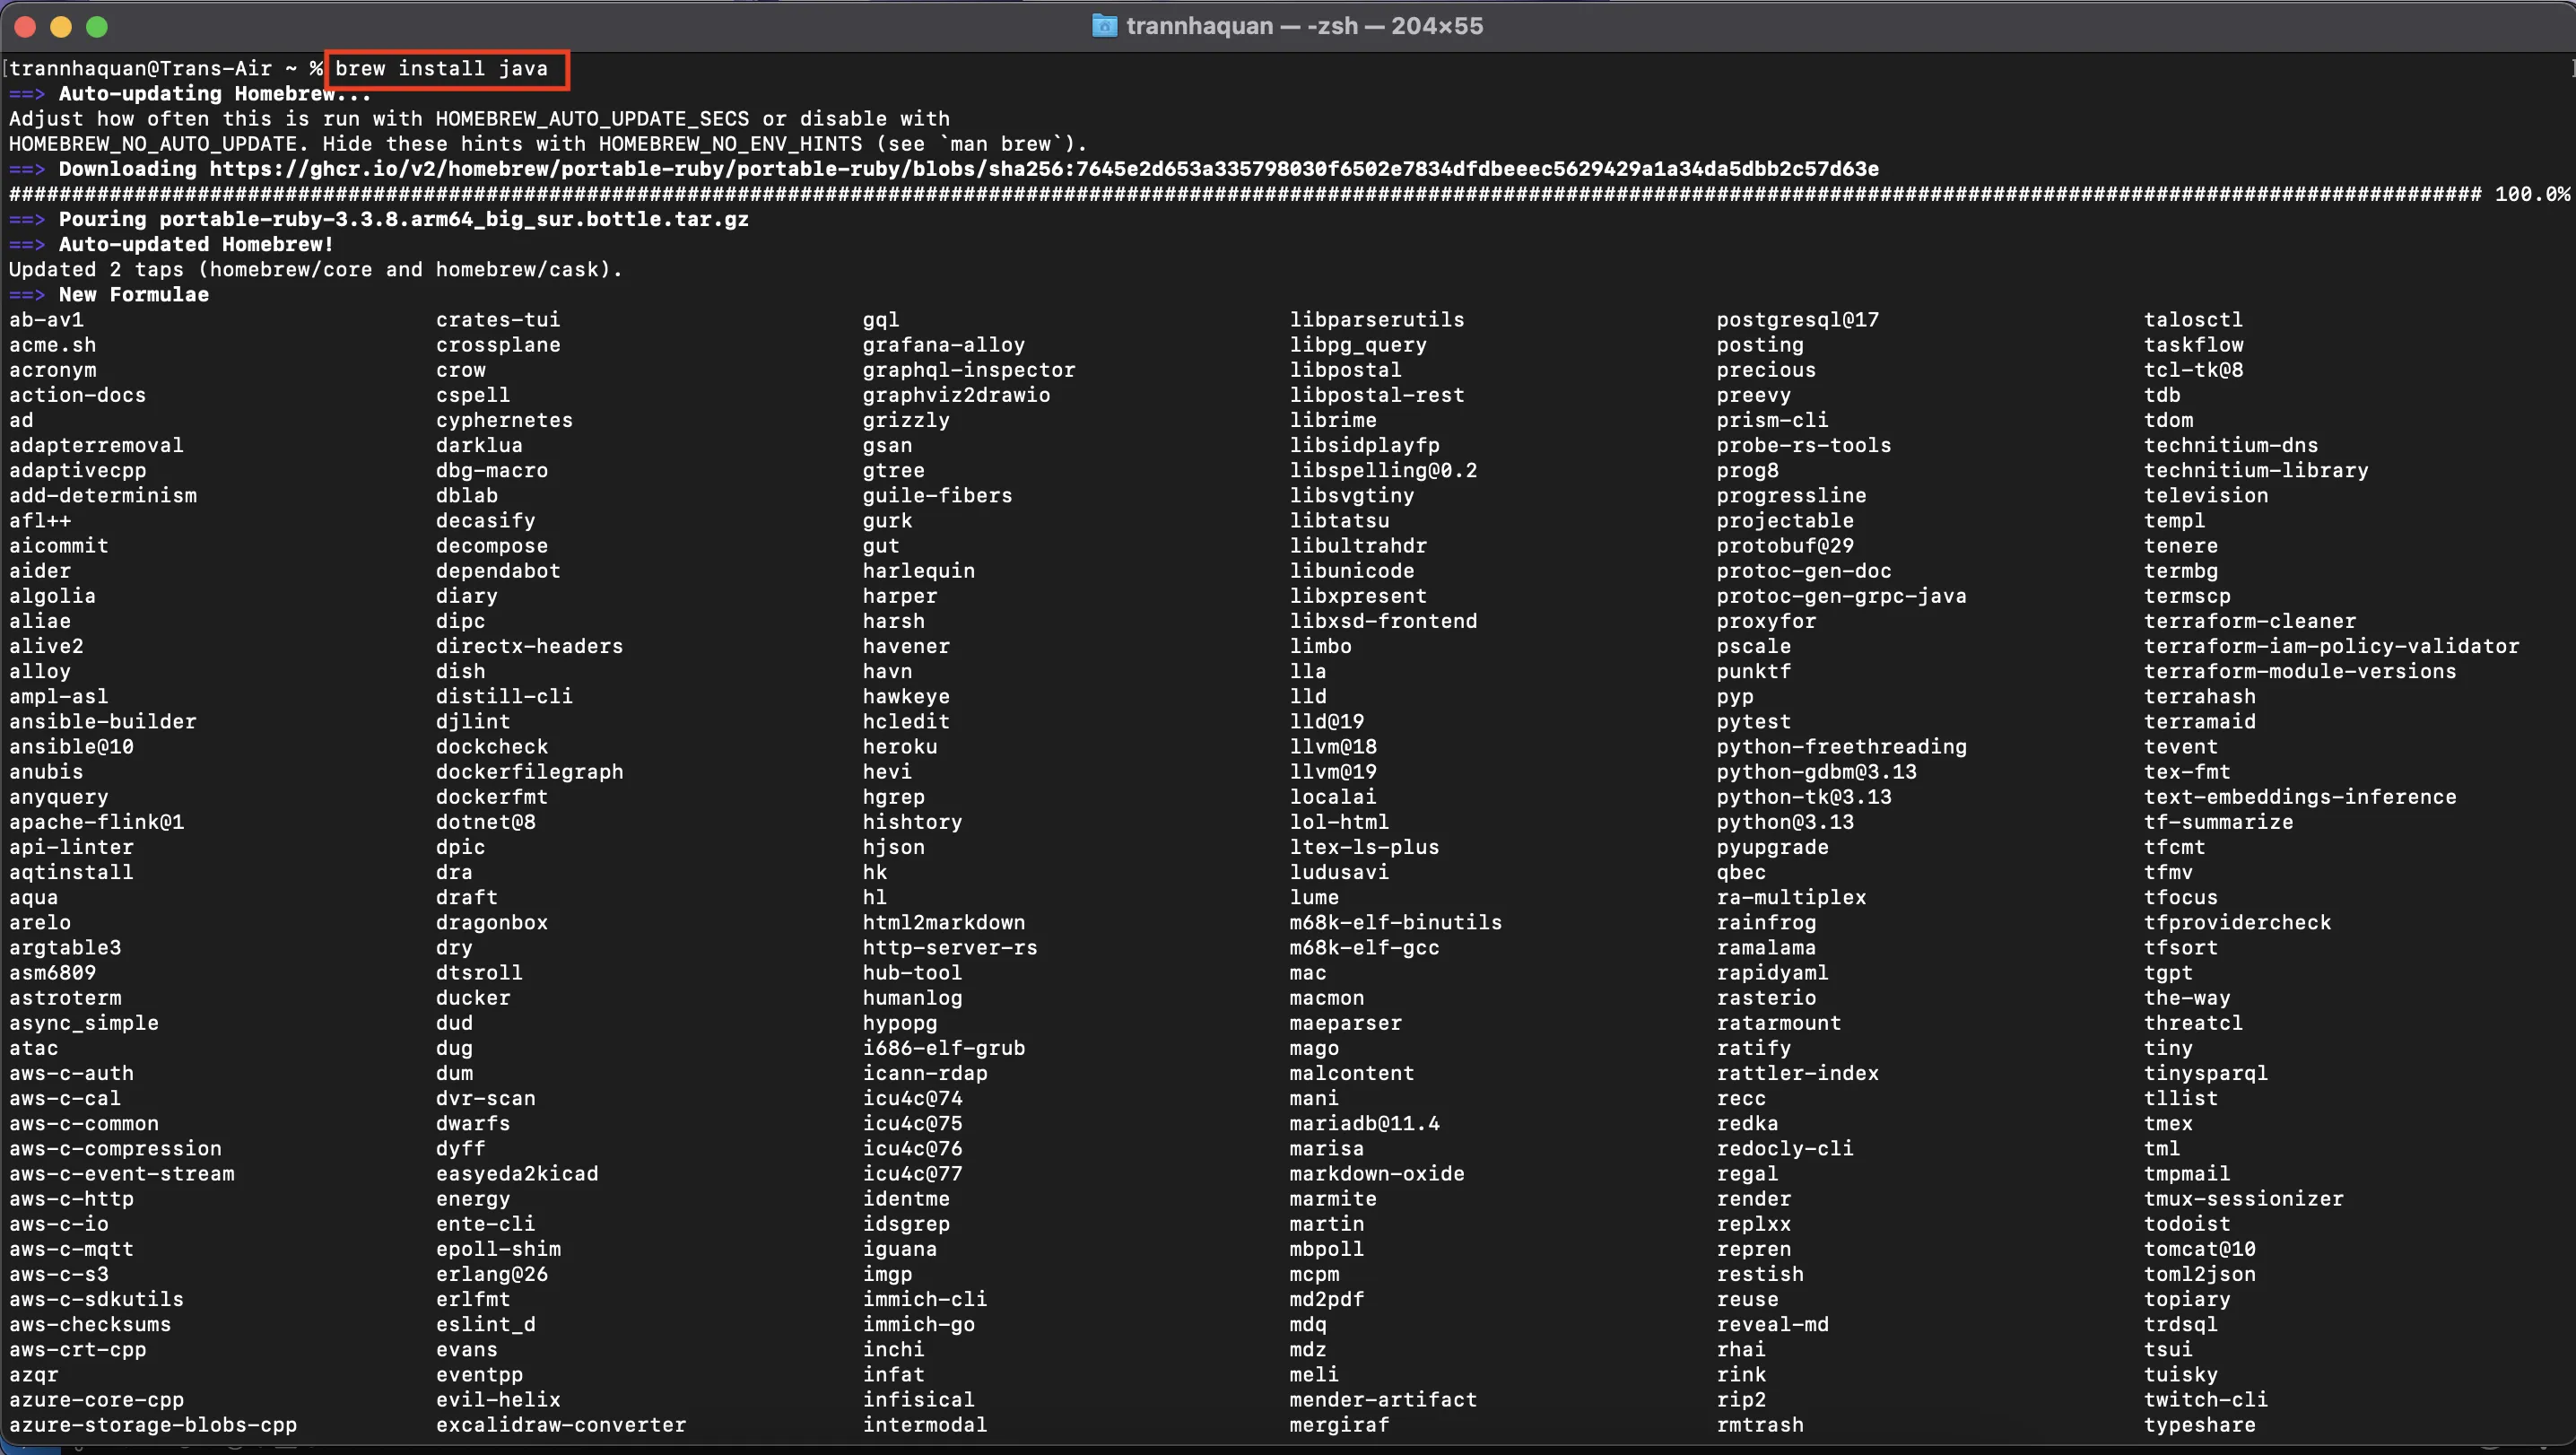
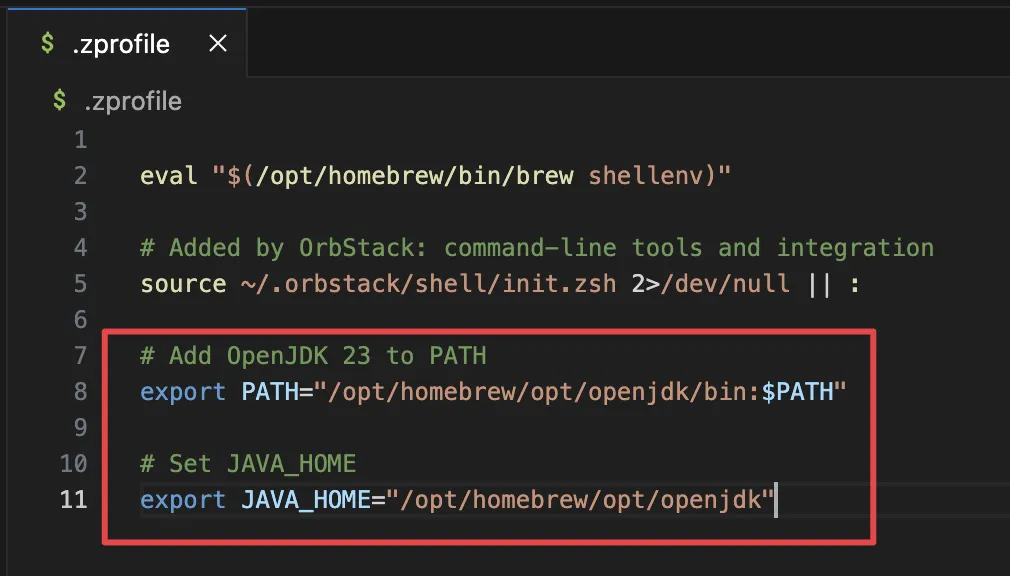

Humor Break: If you don't have Java, running JMeter is like trying to start a car without an engine. Doesn't really go anywhere!
Step 2: Download JMeter
- Head to the official Apache JMeter website: Apache JMeter - Apache JMeter™
- Go to the "Download" section.
- Download the latest "Binaries" zip file (e.g.,
apache-jmeter-x.y.z.zip).
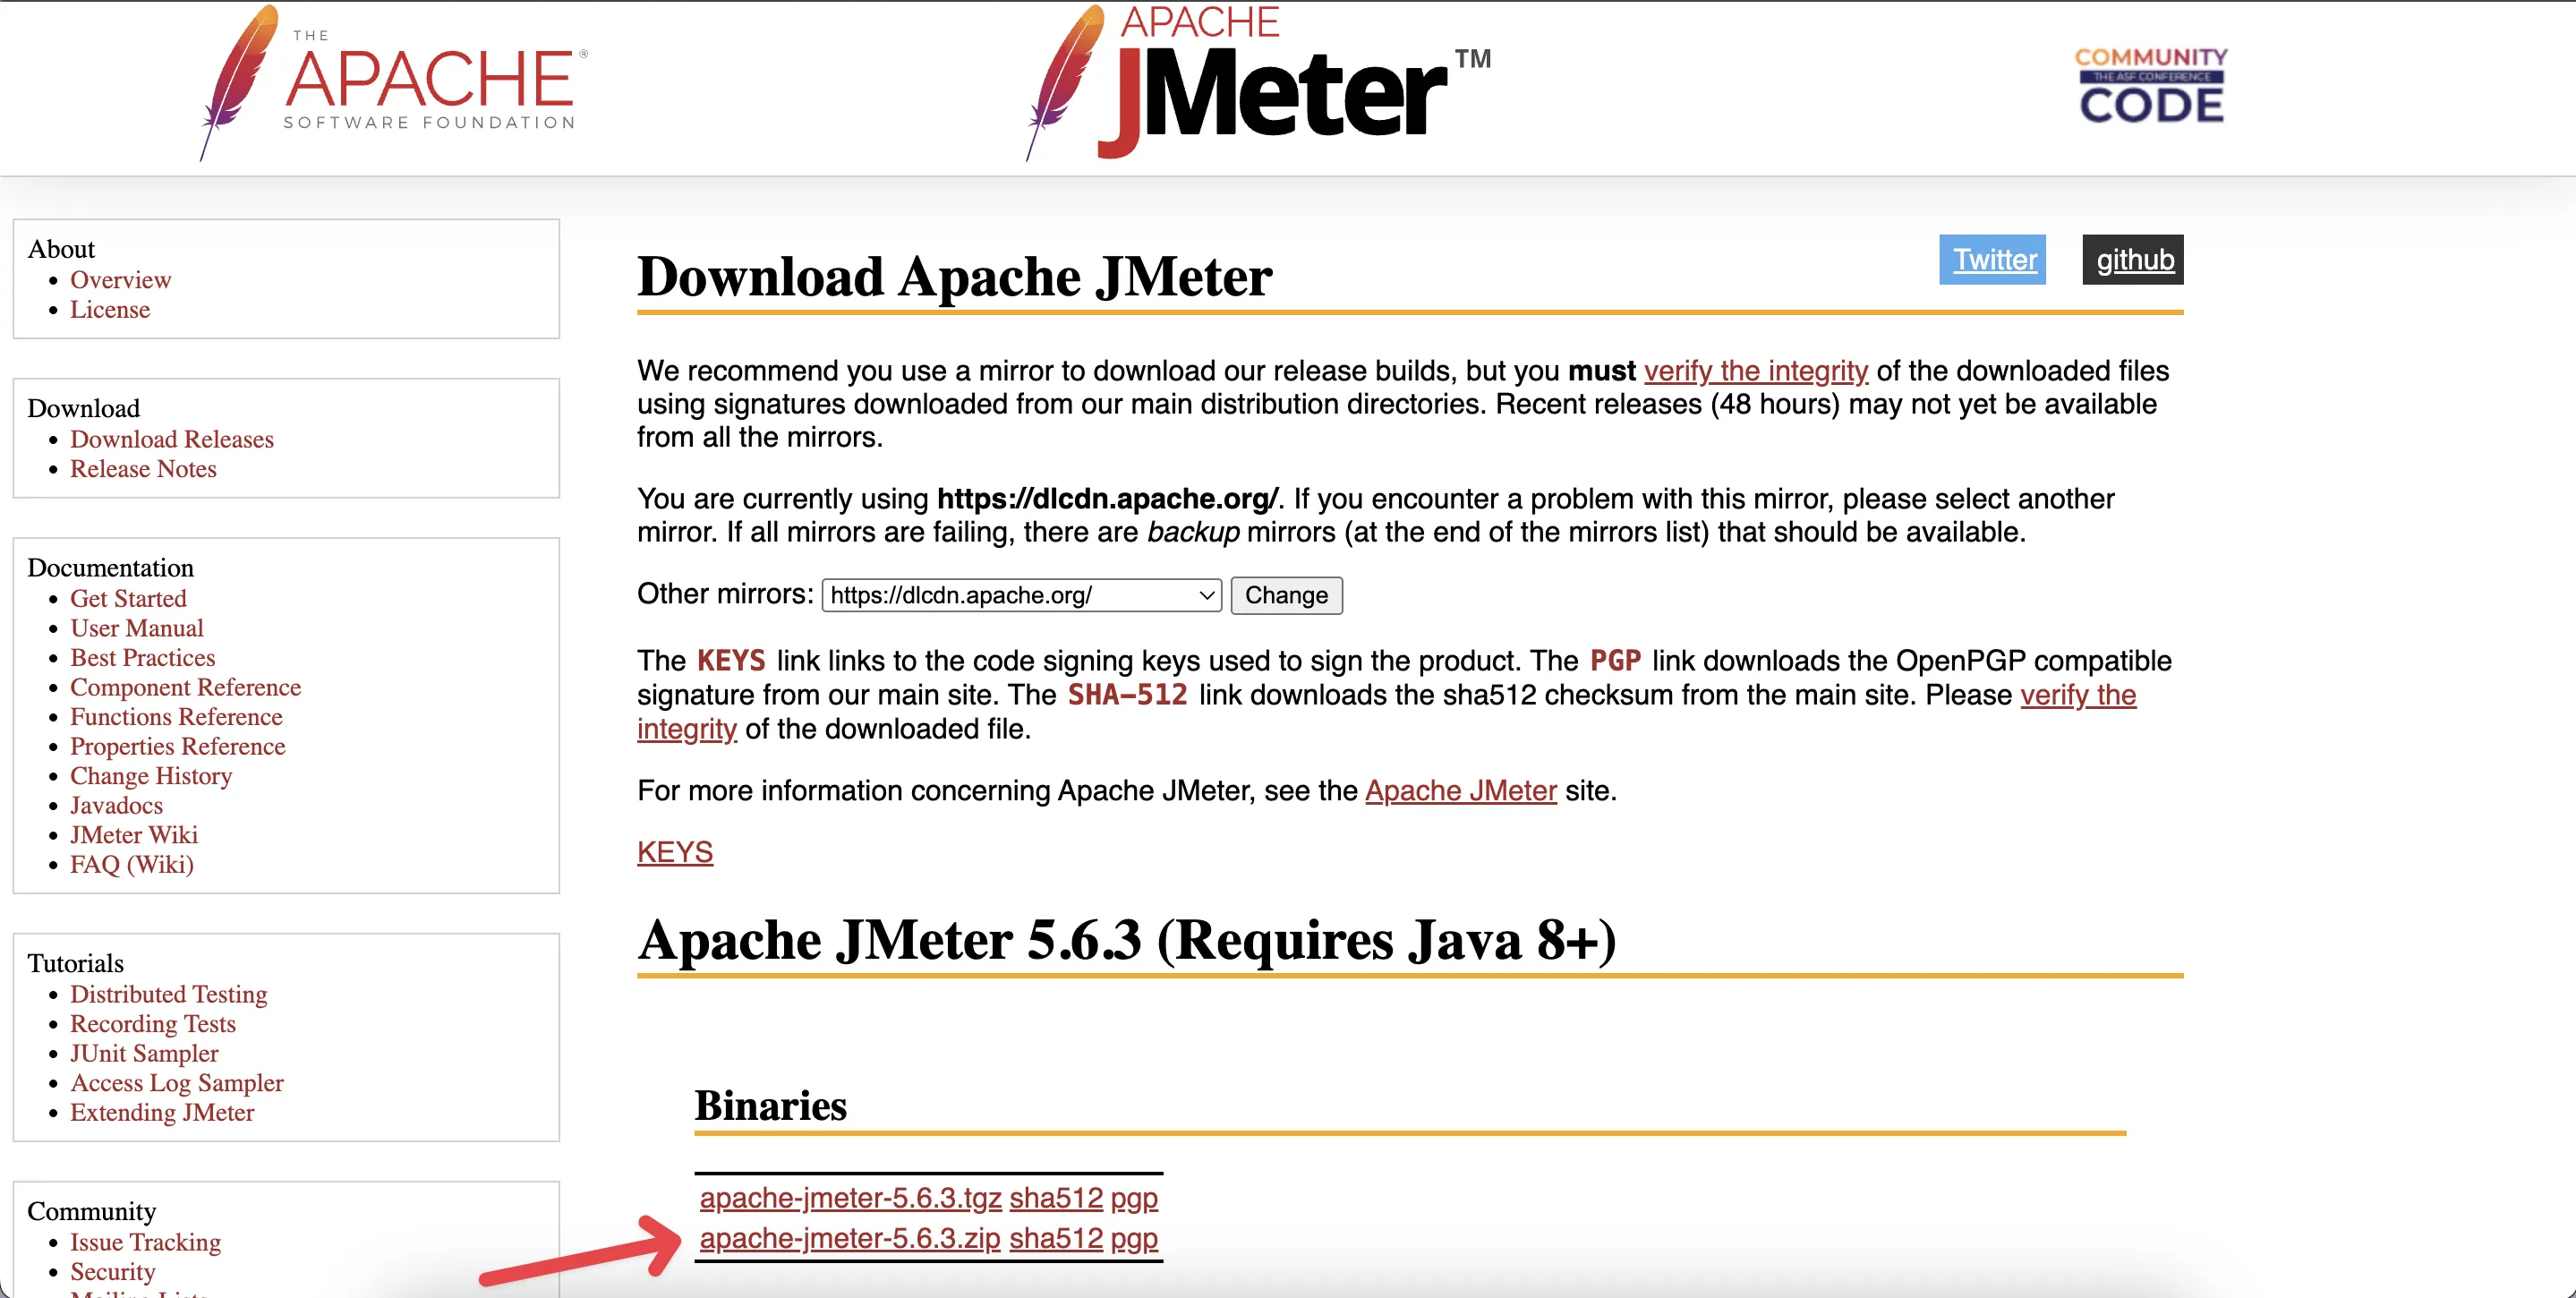
- Extract the zip file to a folder on your computer. Remember where you put it!
Step 3: Launch JMeter
- Navigate to the
binfolder inside the extracted JMeter directory. - Windows: Run
jmeter.bat - macOS/Linux: Run
jmeter.sh(you might need to give it execute permissions first:chmod +x jmeter.sh)
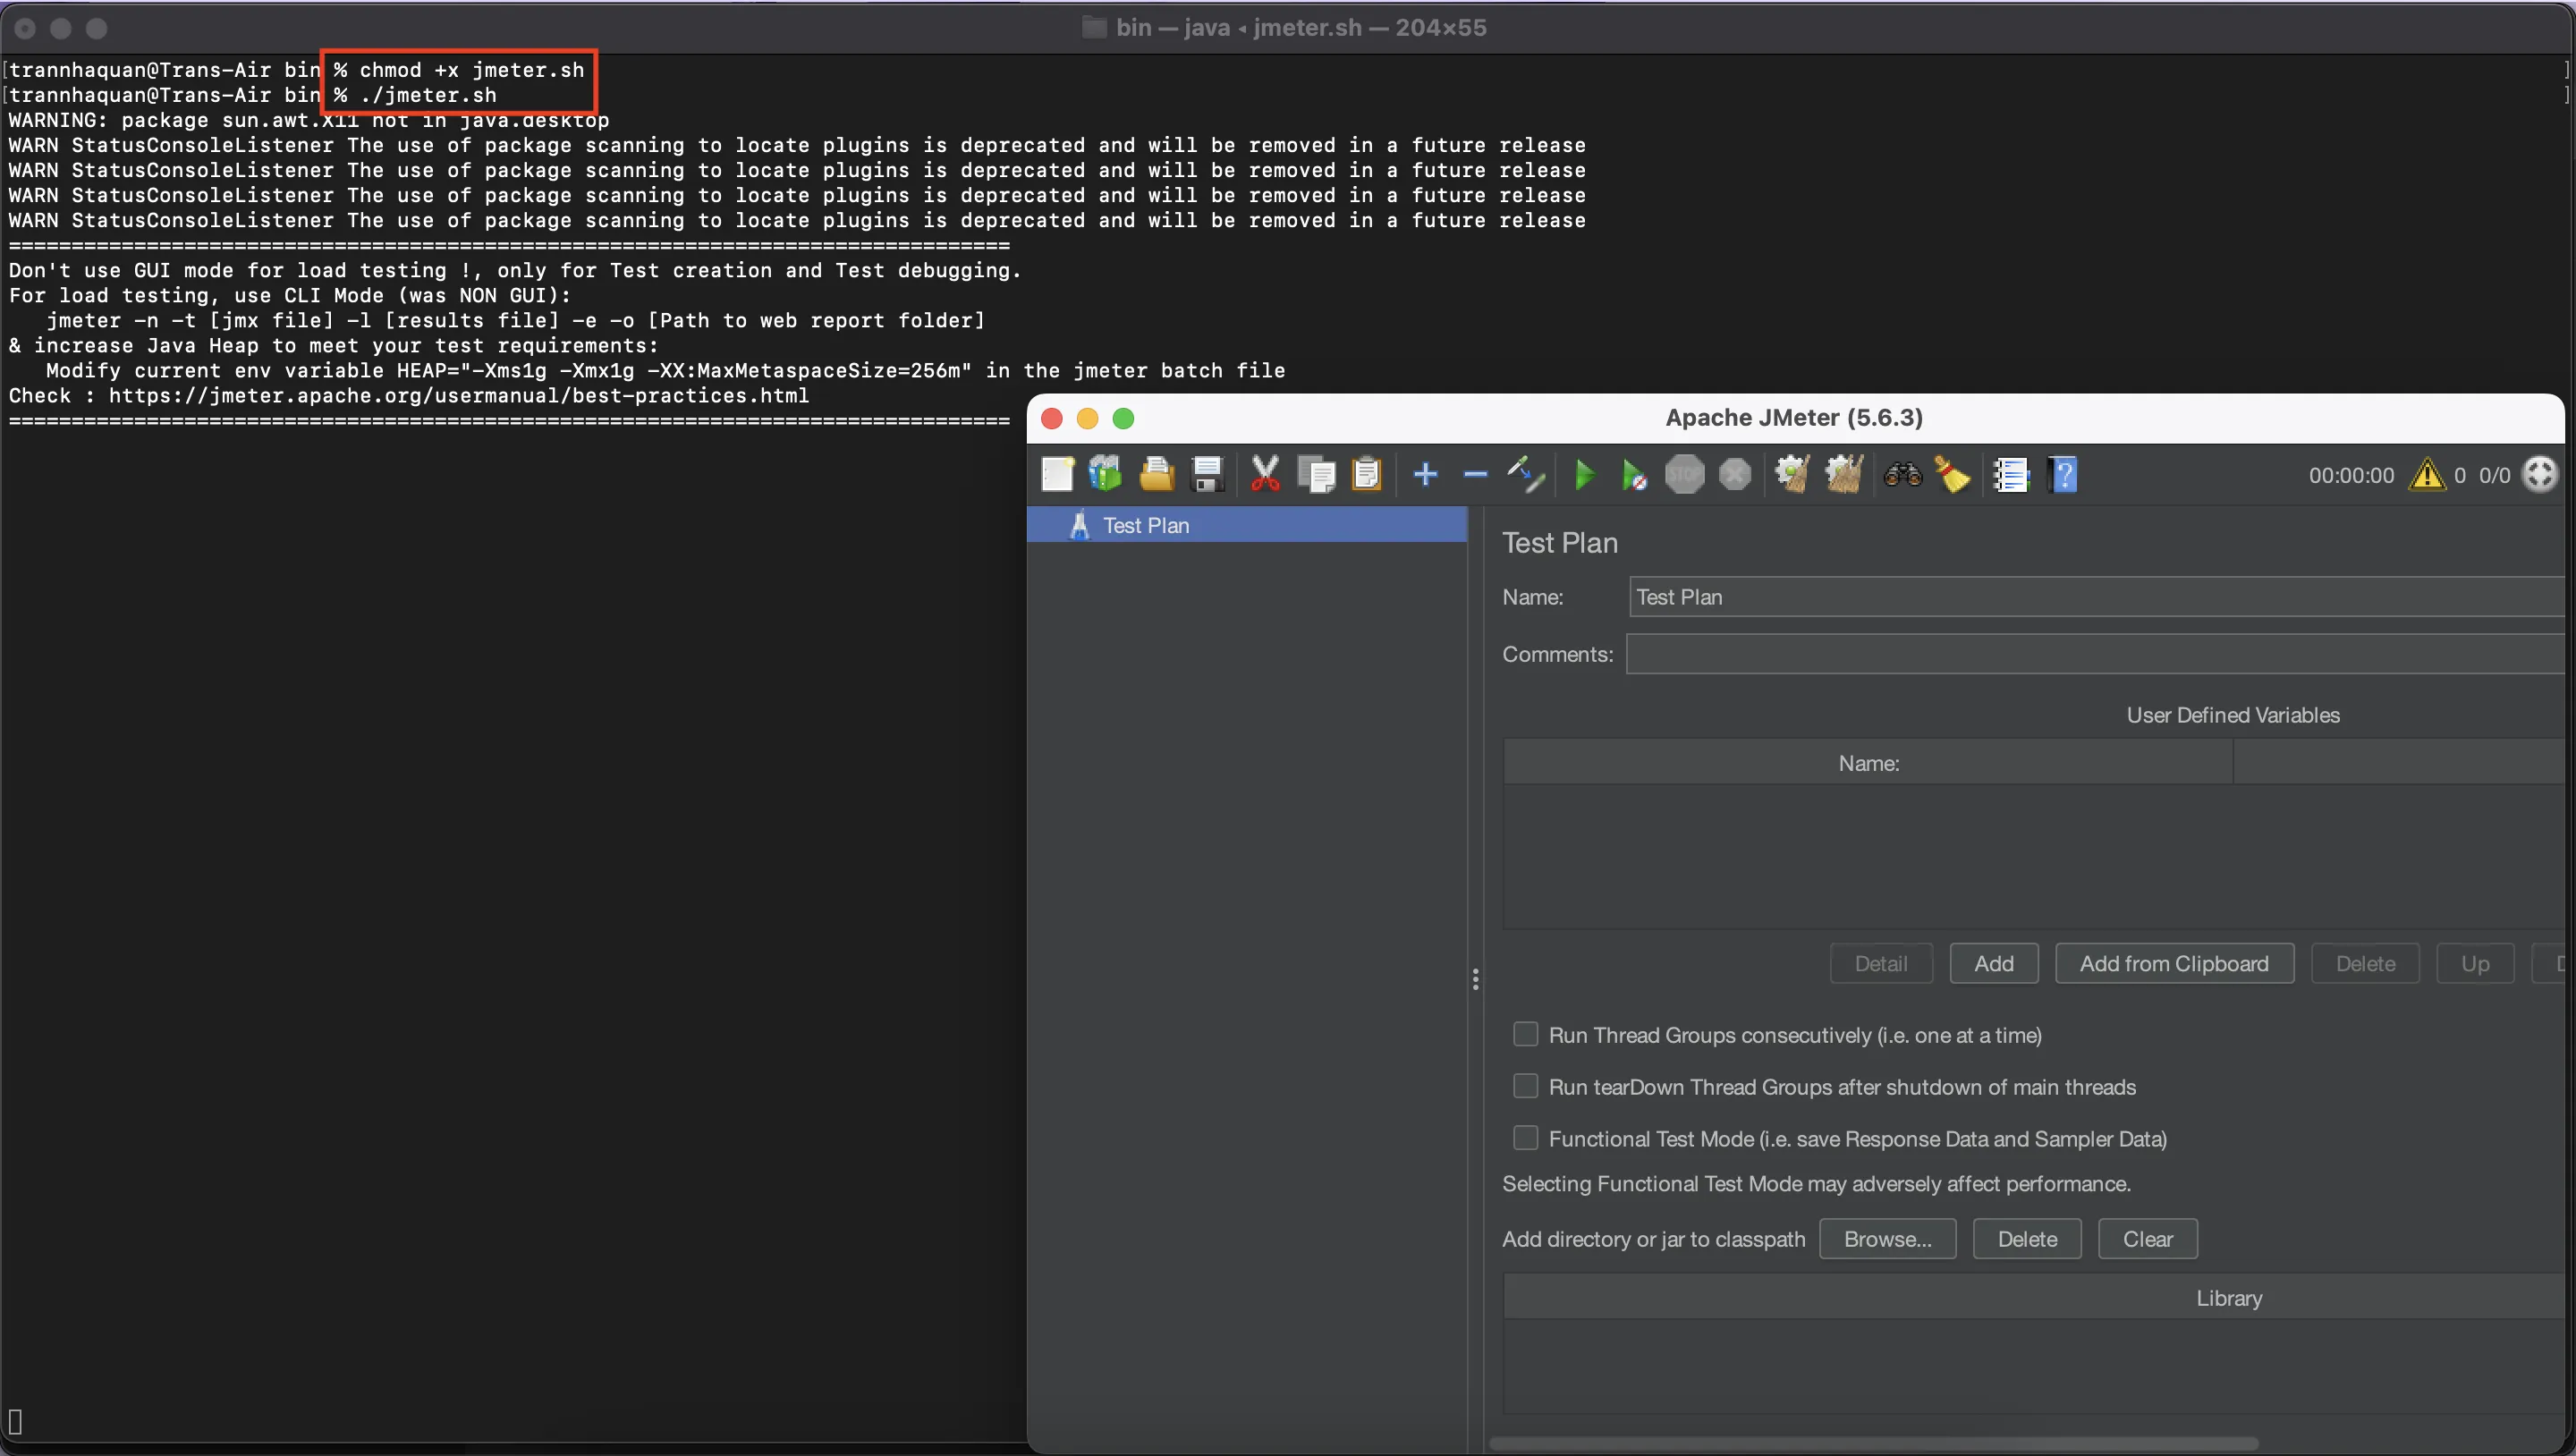
This will open the JMeter graphical user interface (GUI). This is where we'll build our test plan.
Important Note: The GUI is great for creating and debugging test plans, especially with a small number of users. However, for running actual load tests with many users, it's highly recommended to use the command-line (Non-GUI) mode. The GUI itself consumes resources, which can distort your test results under heavy load.
JMeter's Building Blocks: Understanding the Core Components
JMeter test plans are built like a tree structure. Let’s break down the key components you'll work with:
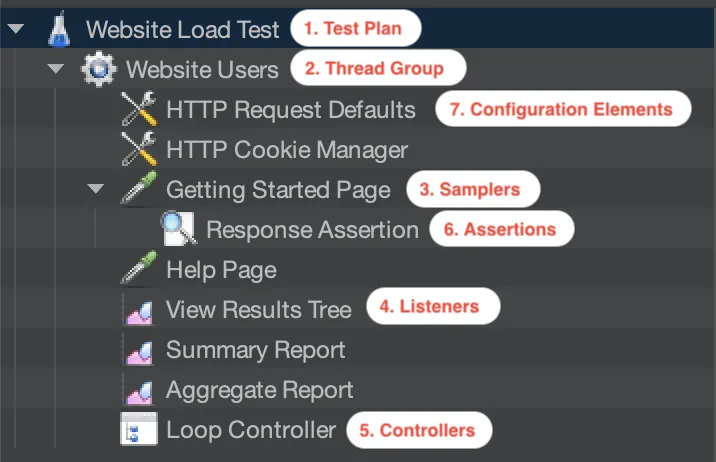
- Test Plan: The root element - the container for everything else. You can define variables here.
- Thread Group: This is where you configure your "virtual users" (threads).
- Number of Threads (users): How many users do you want to simulate simultaneously?
- Ramp-up Period (seconds): How long it takes to start all threads. For example, 100 users over 10 seconds = 10 users started per second. Prevents overwhelming the server at once.
- Loop Count: How many times each thread should execute the test plan. You can even loop "forever" based on a set duration.
Analogy: The Thread Group is like deciding how many soldiers are in your army, how fast they charge, and how many times they attack.
- Samplers: Specific actions your virtual users perform. The most common is the HTTP Request sampler, simulating a user visiting a page or calling an API (you configure server name, path, method, parameters, etc.).
Analogy: Samplers are the tasks assigned to soldiers: "Run to the flagpole," "Salute the general," "Deliver a message.”
- Listeners: These collect and display test results.
- View Results Tree: Shows full details of each request and response - great for debugging but memory-intensive for large tests.
- Summary Report / Aggregate Report: Provide key metrics (Average Response Time, Throughput, Error %). Best for analyzing large test runs, especially when running in non-GUI mode.
- Graph Results: Visualize performance trends over time.
Analogy: Listeners are the reporting stations on the battlefield, collecting data and generating different kinds of reports.
- Controllers: These control how Samplers are executed.
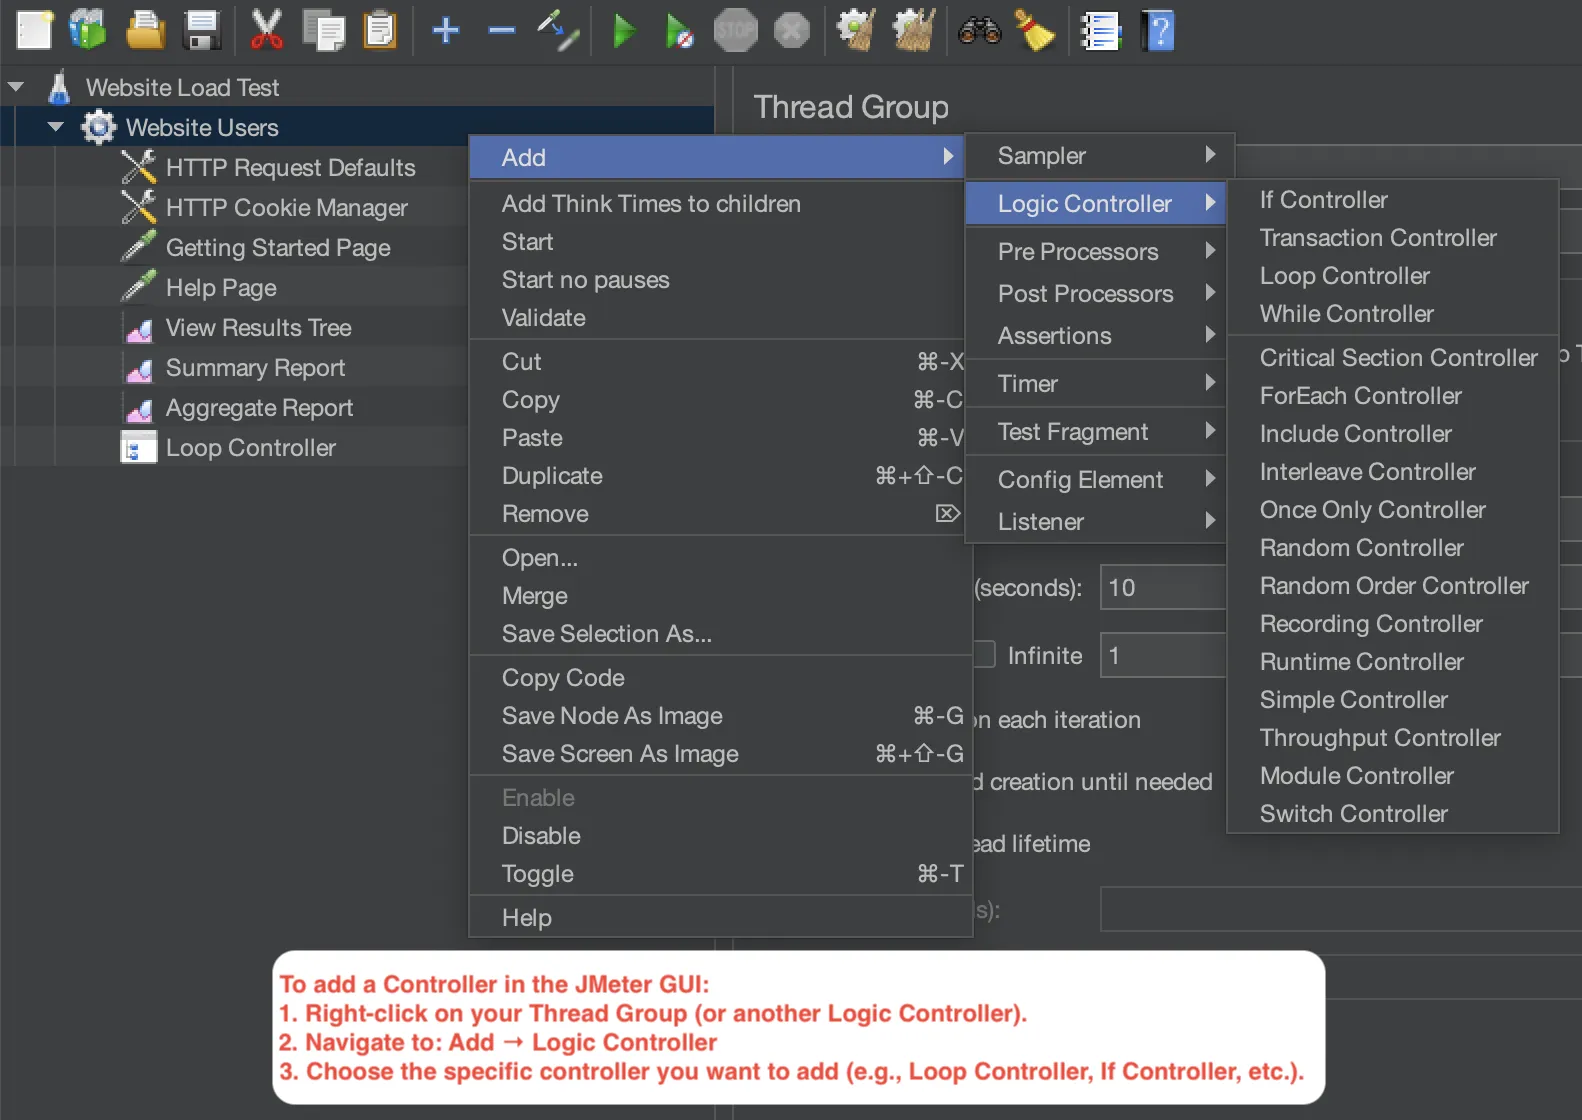
- Loop Controller: Repeats its child elements a specified number of times.
- Once Only Controller: Runs its child elements only once per thread - often used for login steps.
- Transaction Controller: Groups multiple samplers and measures their total time - useful for end-to-end workflows (e.g., Login → Search → View Product).
Analogy: Controllers are the drill sergeants giving orders: "Repeat five times," "Do this once at the start," "Measure the whole mission time."
- Assertions: Used to validate if the response matches your expectations.
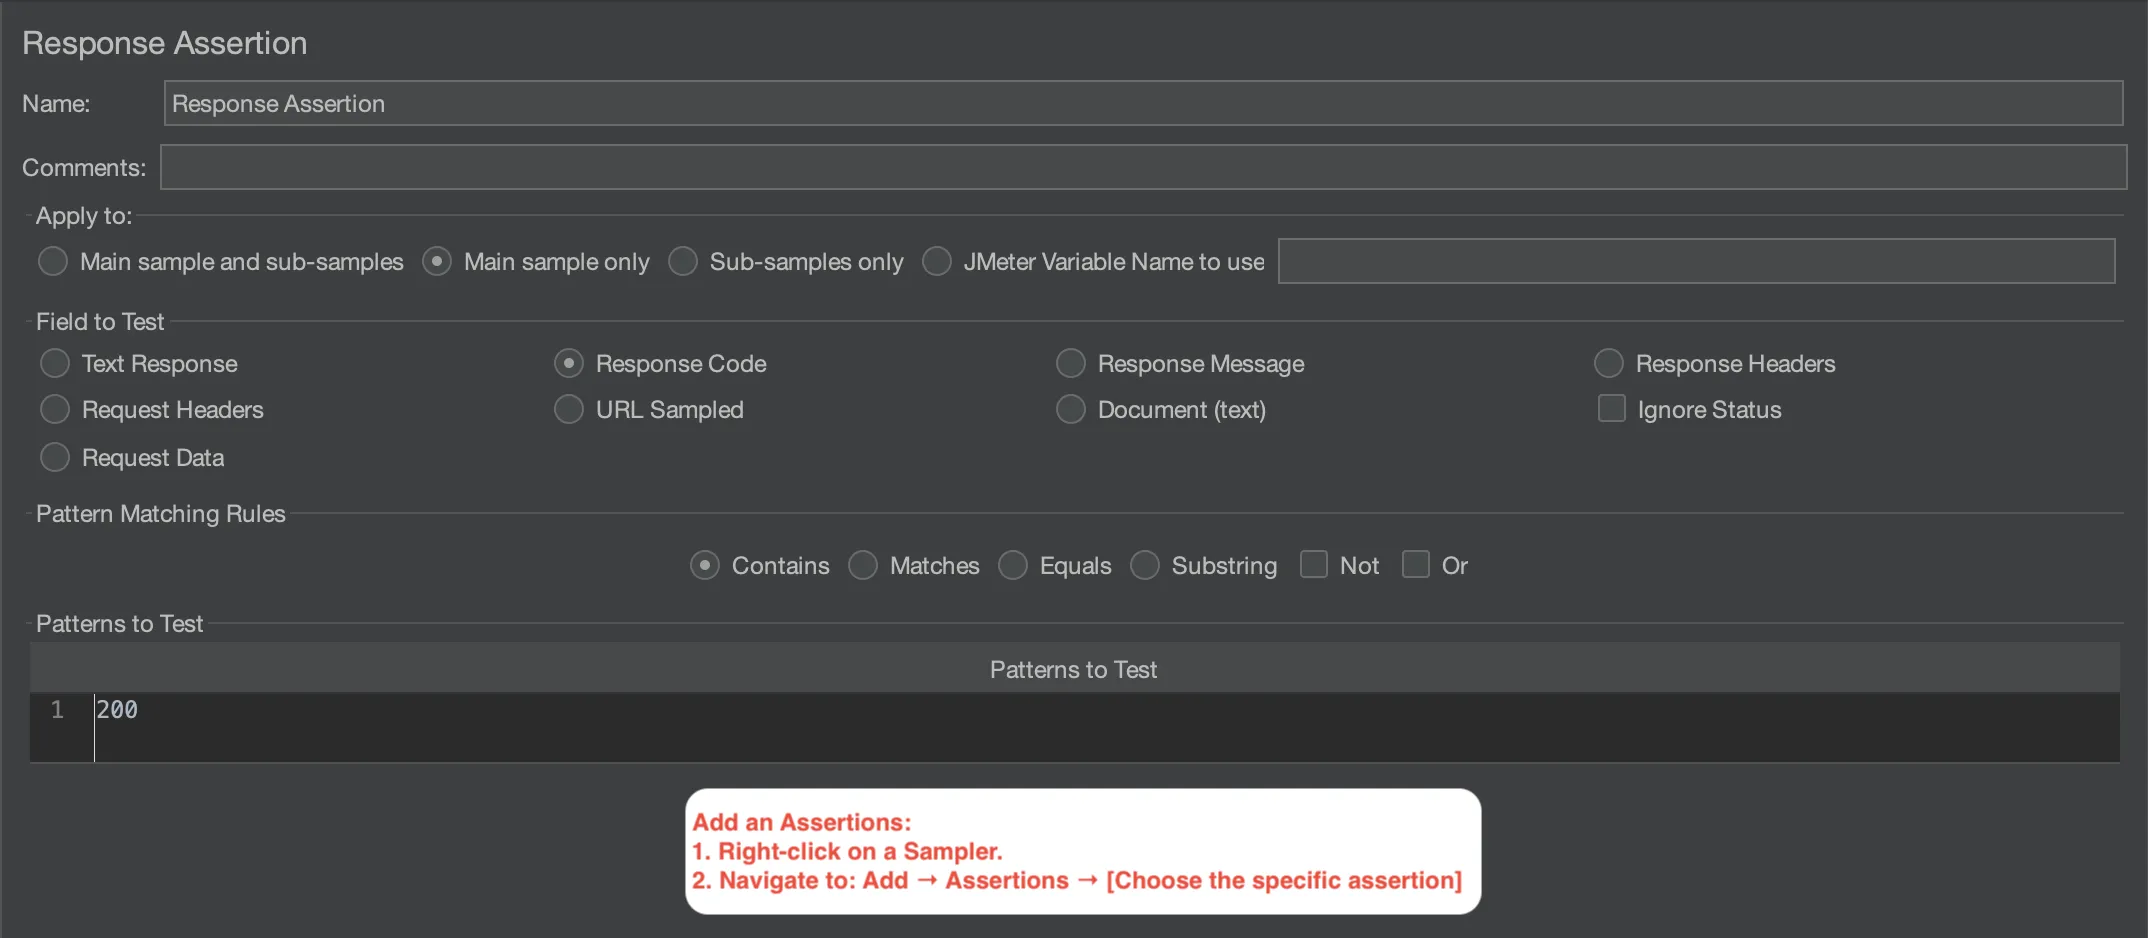
- Response Assertion: Verifies response body, headers, or status code. Critical for checking both speed and correctness.
Analogy: Assertions are like soldiers double-checking their gear after a mission: "Is my rifle still here? Check!" If not, something went wrong.
- Configuration Elements: Define default settings and variables used across samplers.
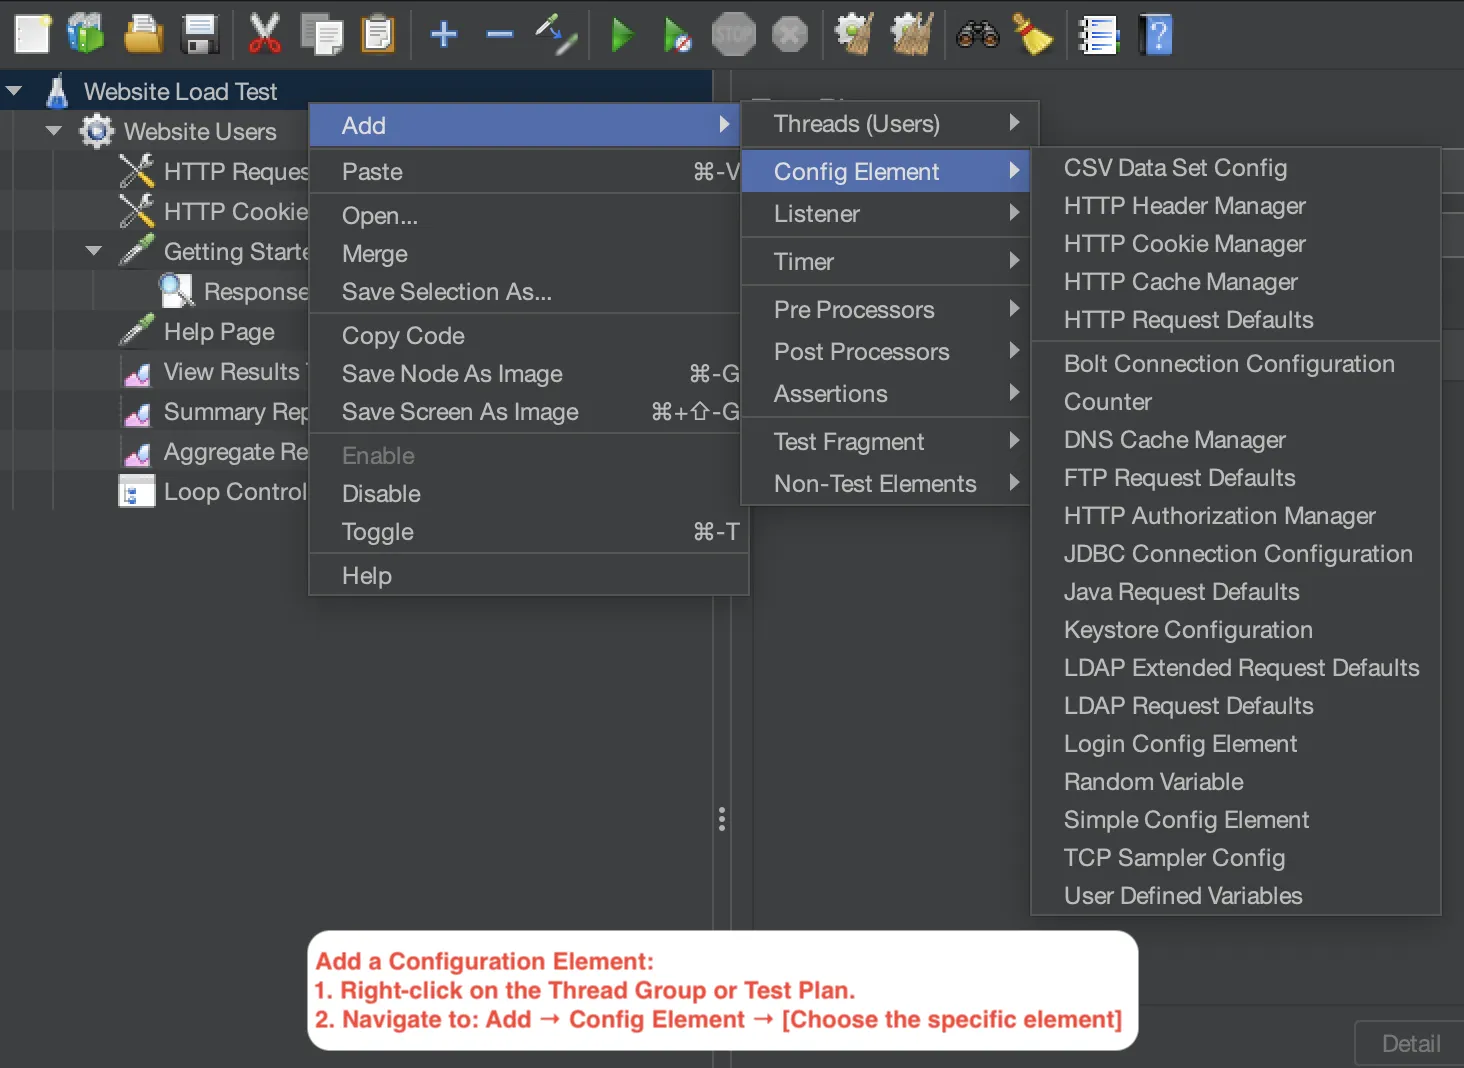
- HTTP Request Defaults: Predefine common server info, path prefixes, etc.
- HTTP Cookie Manager: Manages cookies automatically - essential for handling sessions in web tests.
- User Defined Variables: Store reusable values (server names, login credentials) to make maintenance easier.
Analogy: Configuration Elements are the initial briefing soldiers receive: "Target server is X," "Handle cookies like this," "These are the general battle rules."
Understanding these components is crucial for building effective and scalable JMeter test plans. Think of it like building a smart, battle-ready army - and JMeter gives you full command!
Hands-On: Building a Simple Load Test Script
Let's create a basic test plan to simulate users hitting a website. We'll simulate:
- Visiting the "Getting Started" page.
- Visiting an "Help" page.
- Note: For a real test, you'd use a non-production environment and get permission! We'll use a placeholder like
example.comor a test site if available.
-
Start JMeter GUI.
-
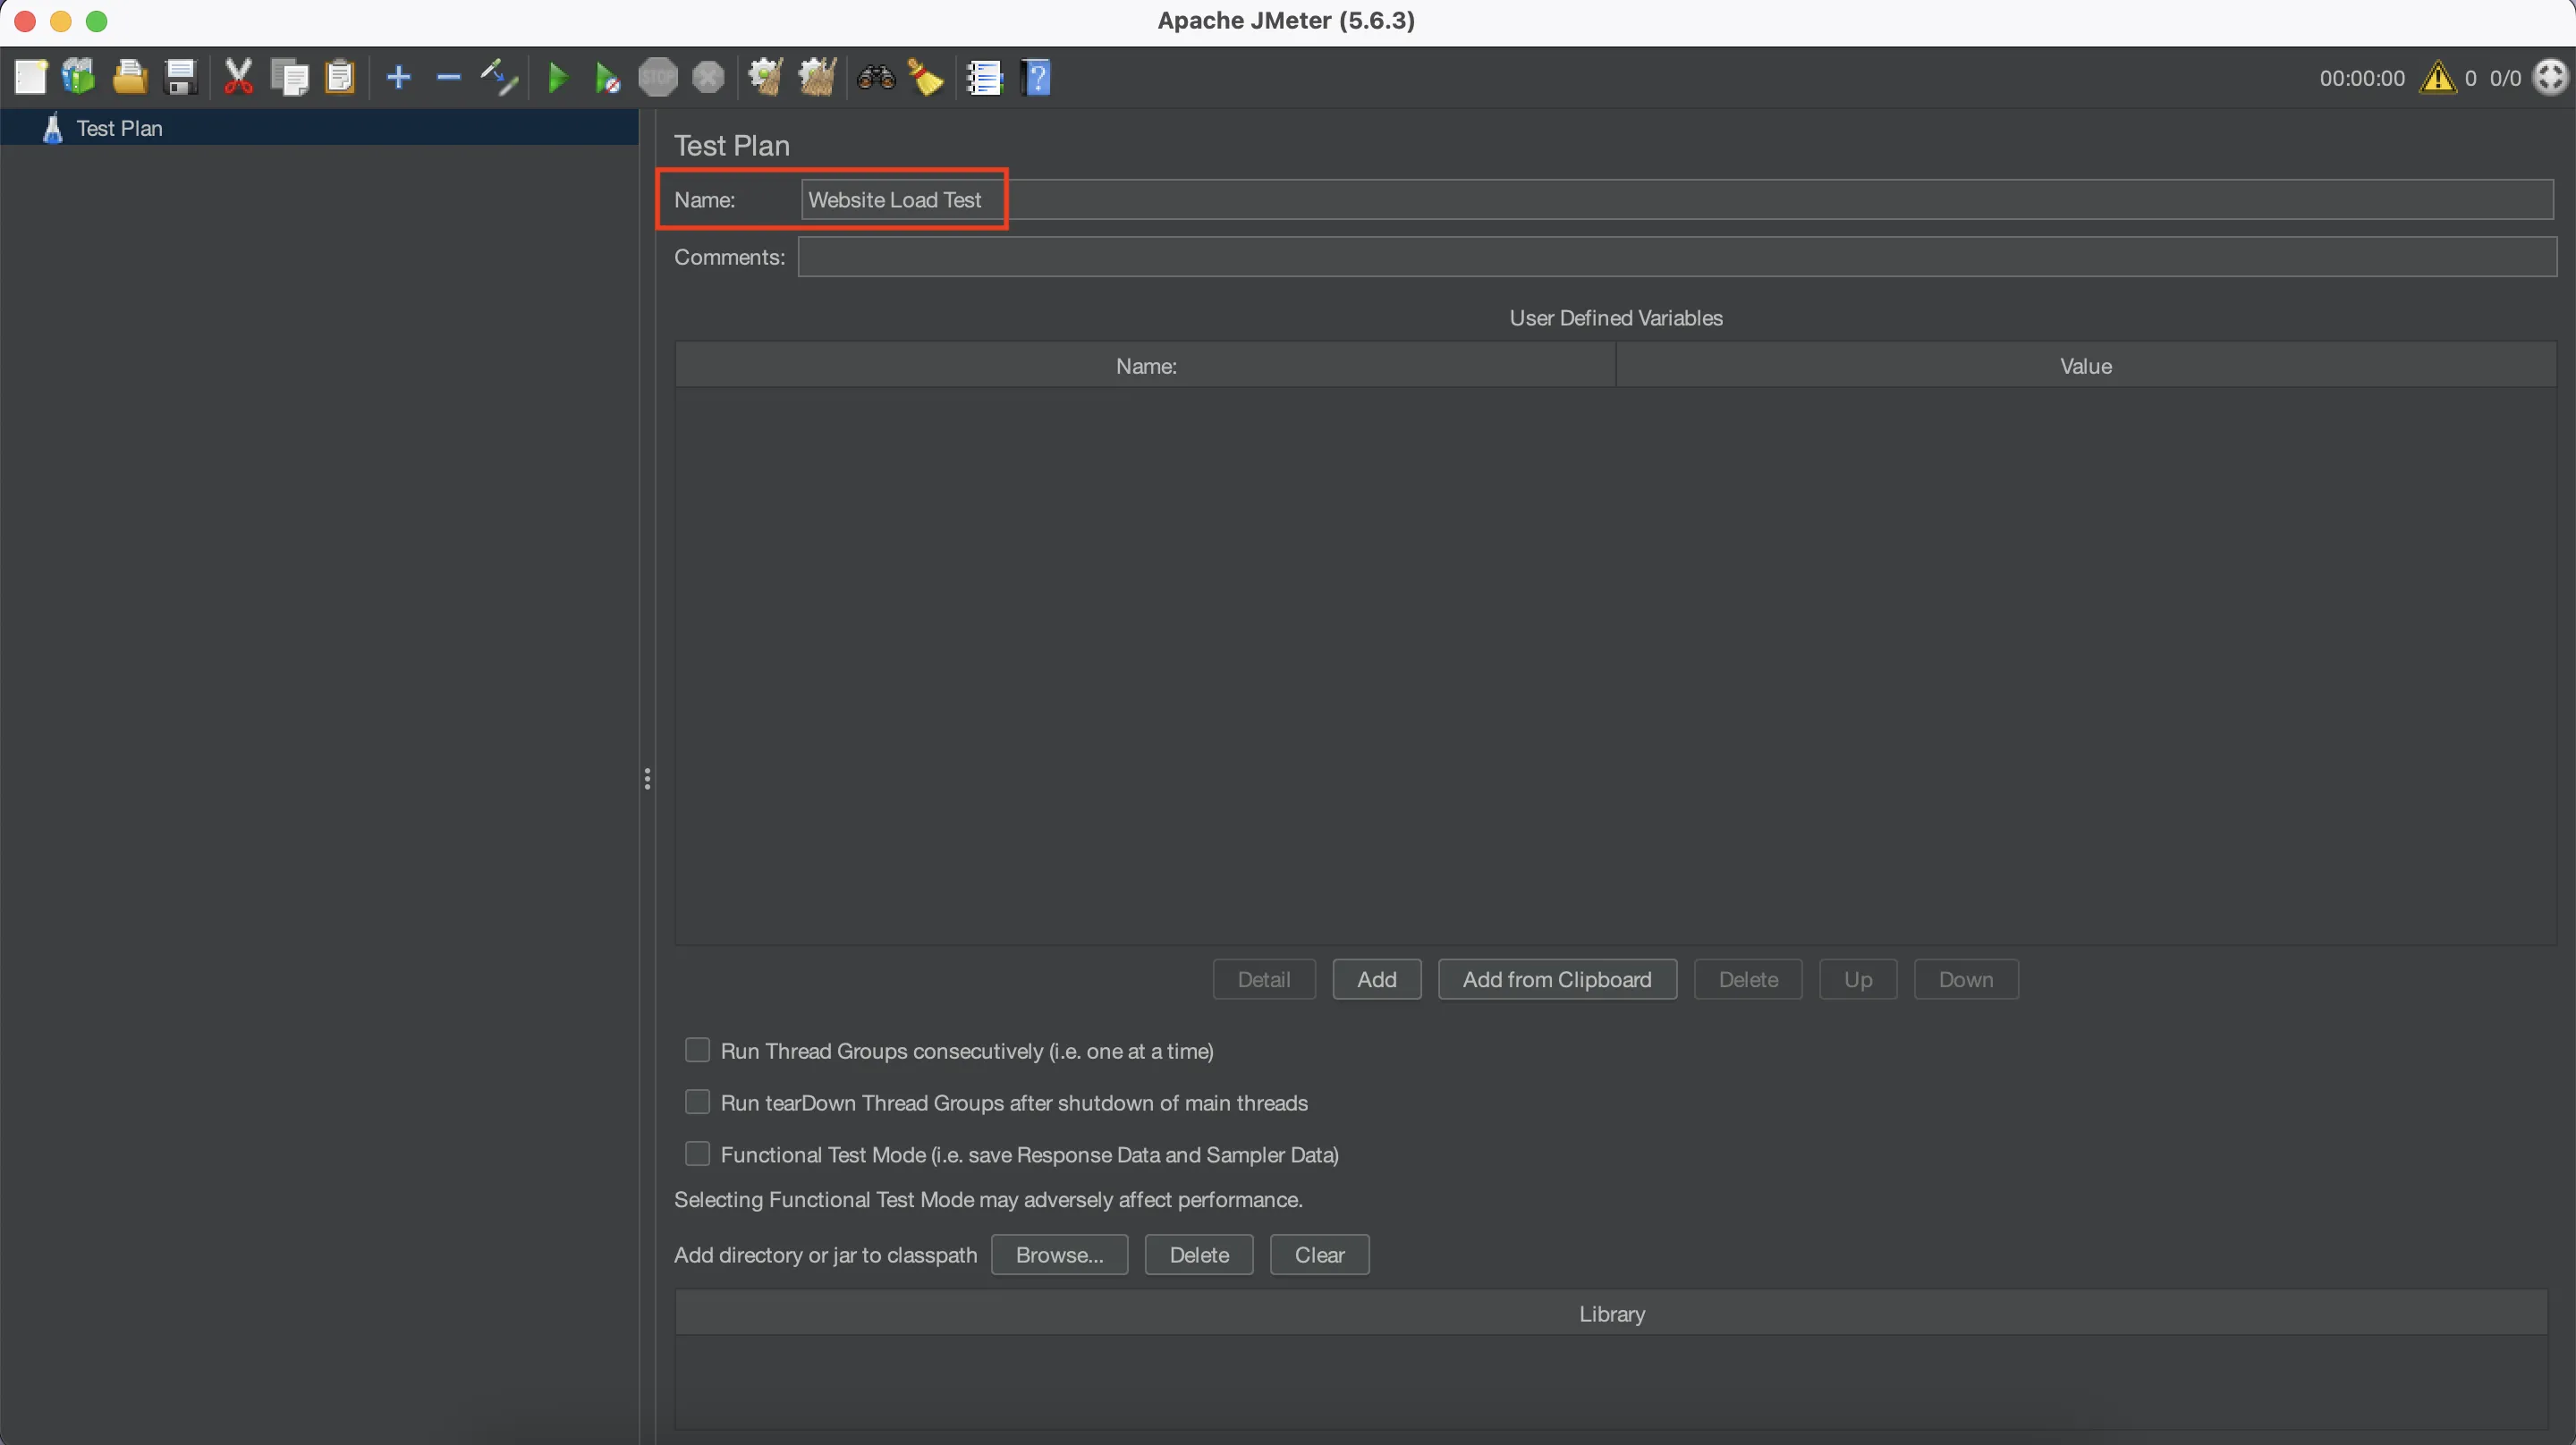
Rename the Test Plan: In the tree view on the left, select "Test Plan." In the right panel, change the "Name" to something like "Website Load Test".
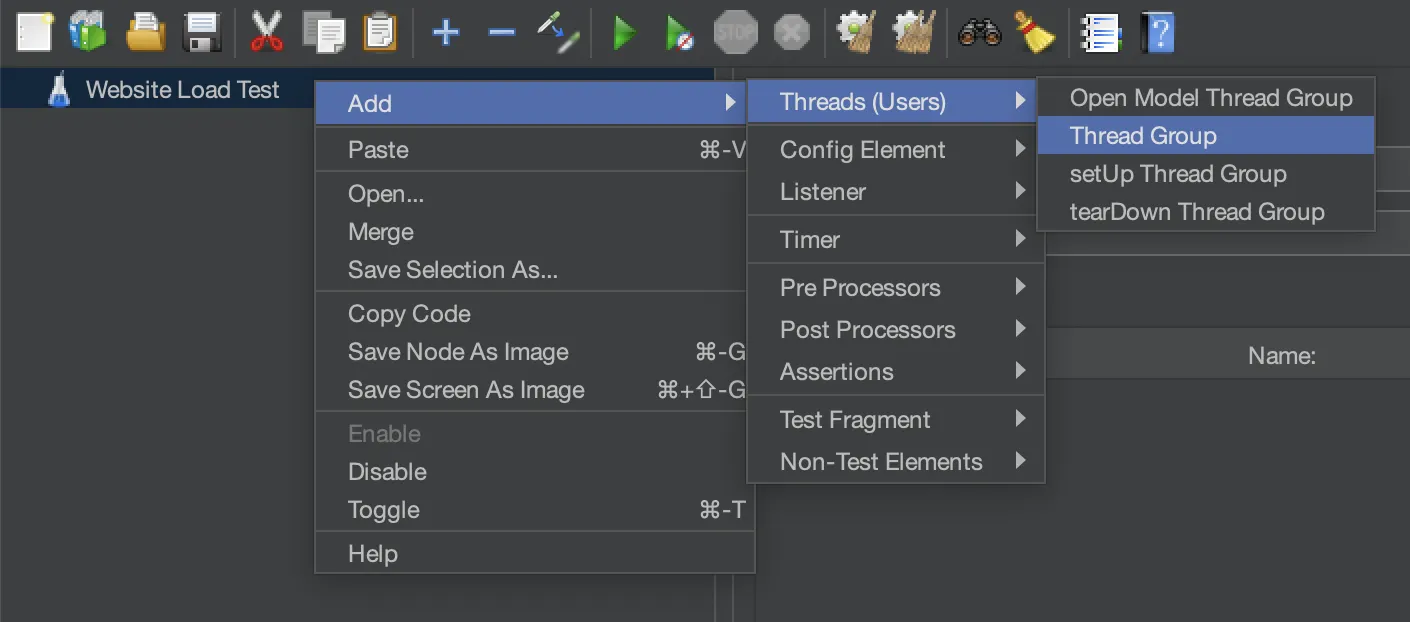
- Add a Thread Group: Right-click "Test Plan" → Add → Threads (Users) → Thread Group.
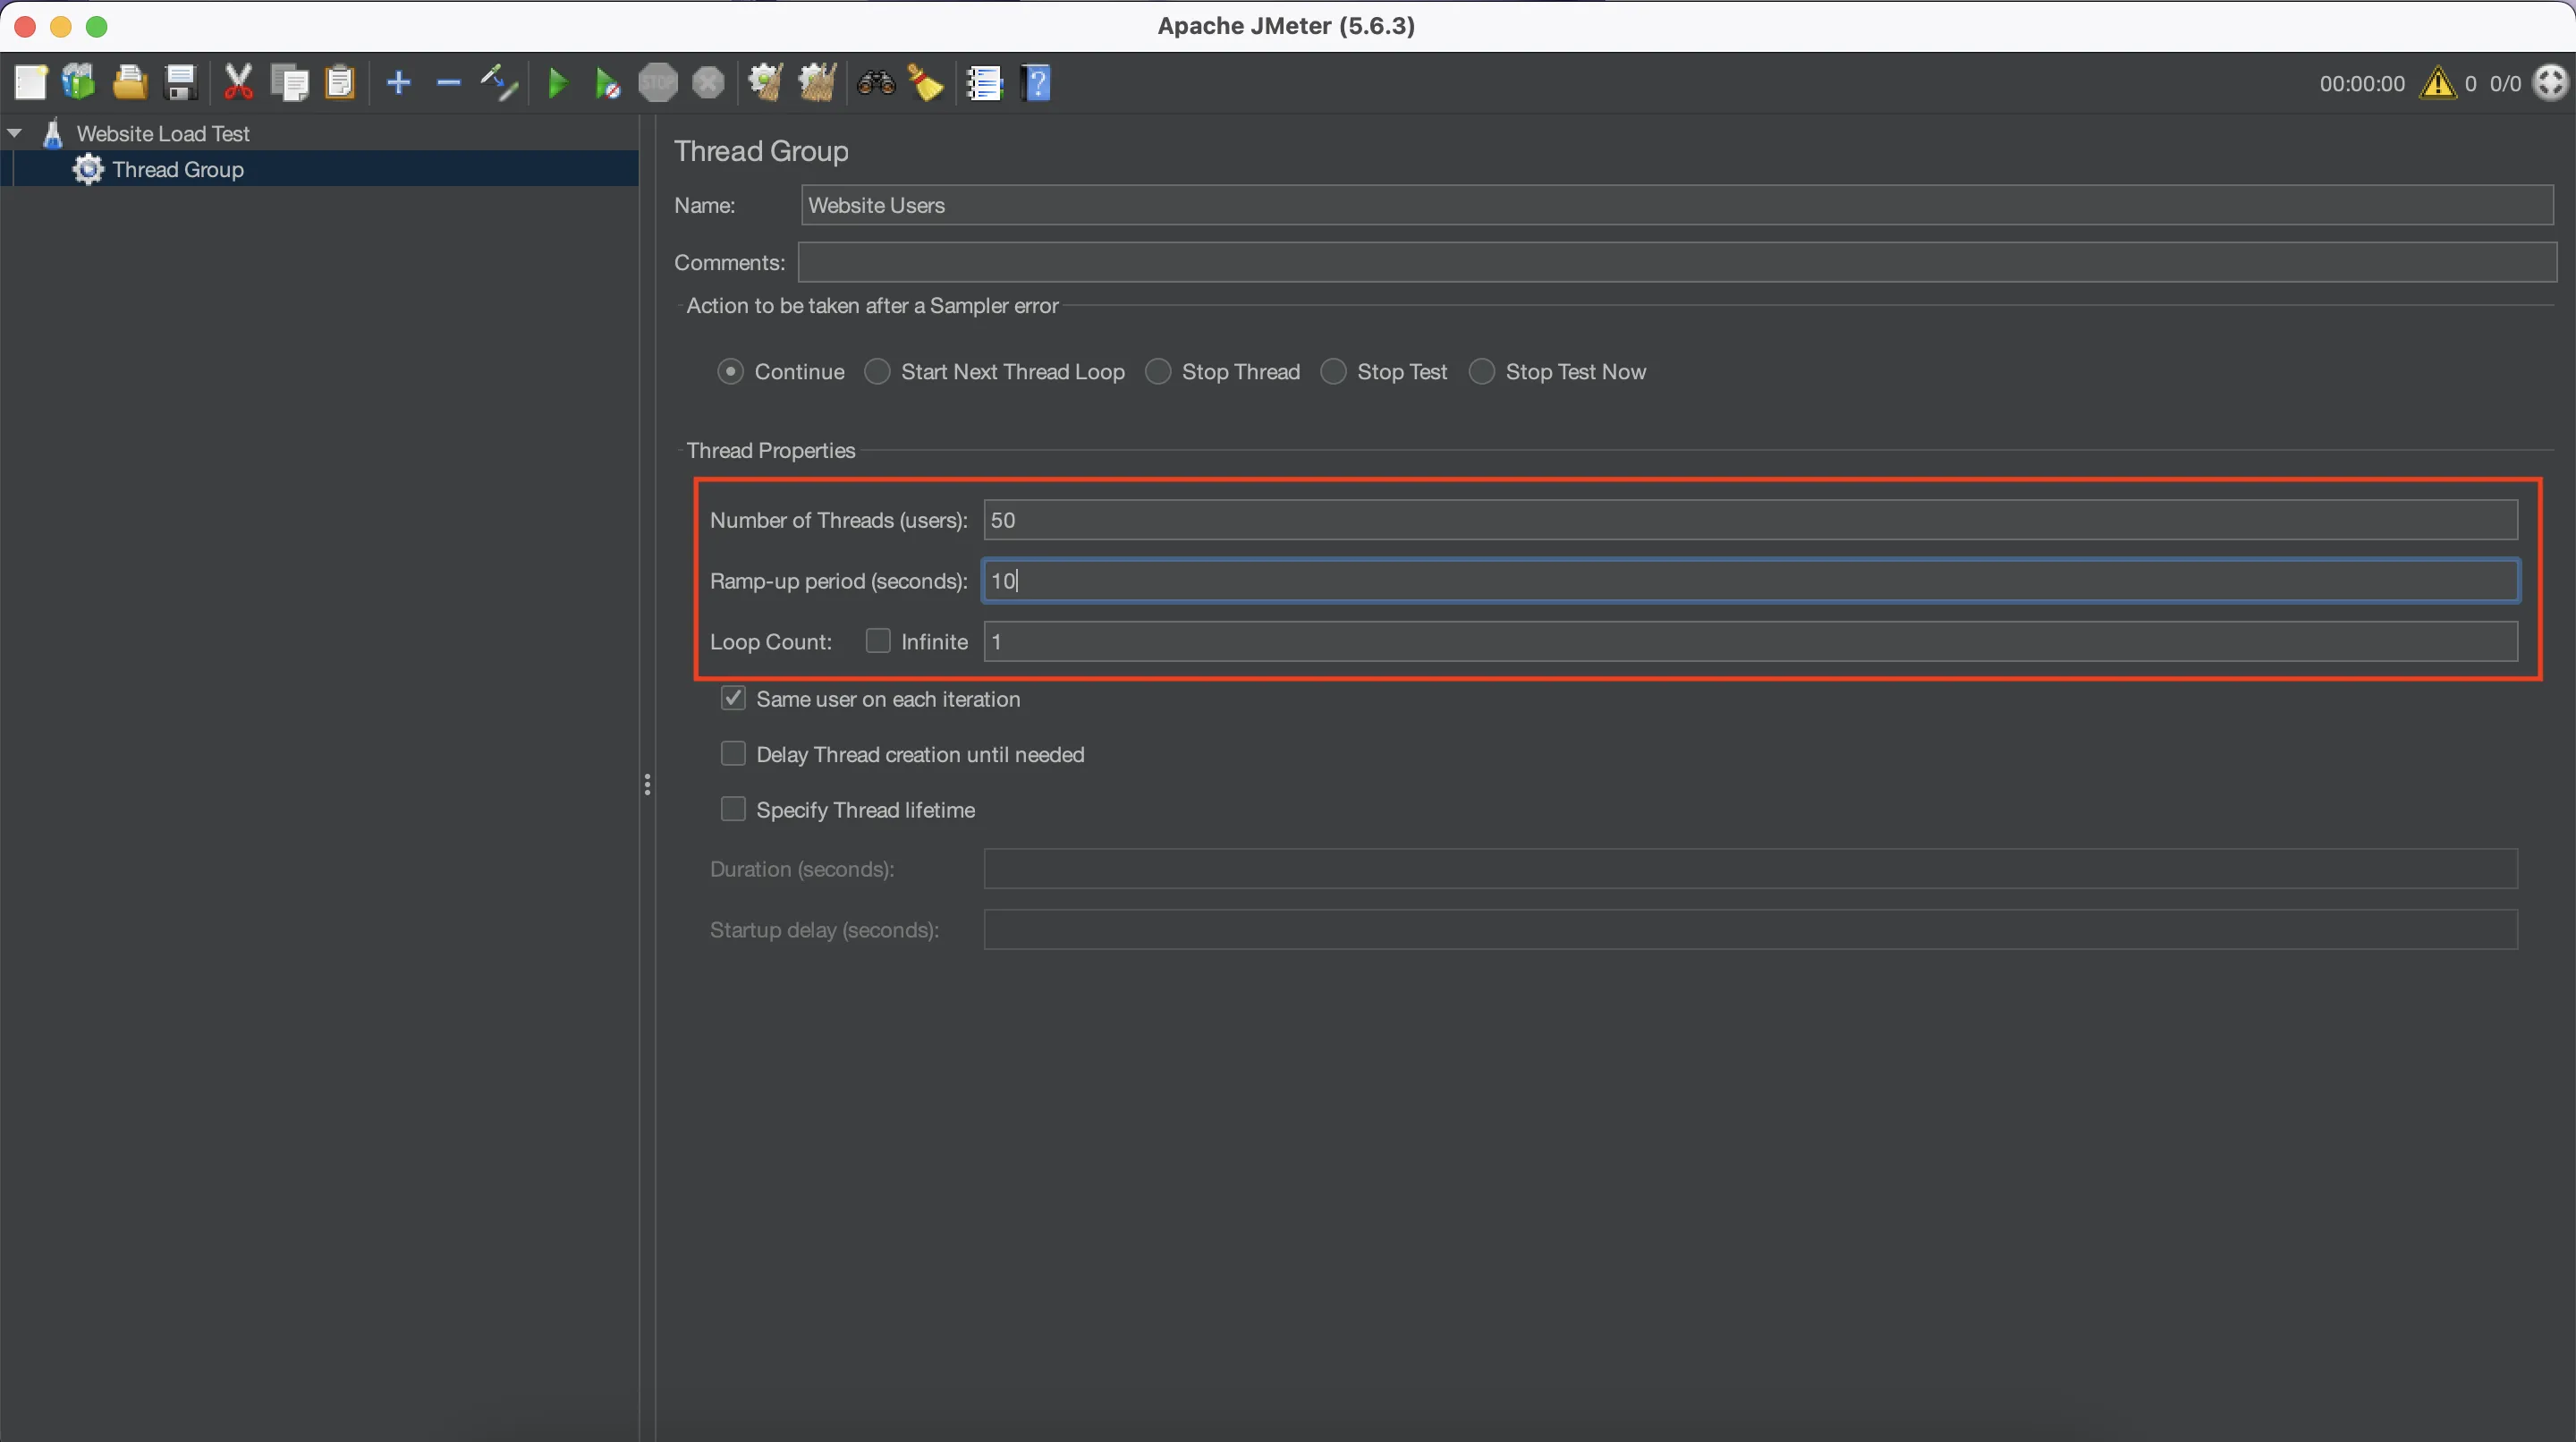
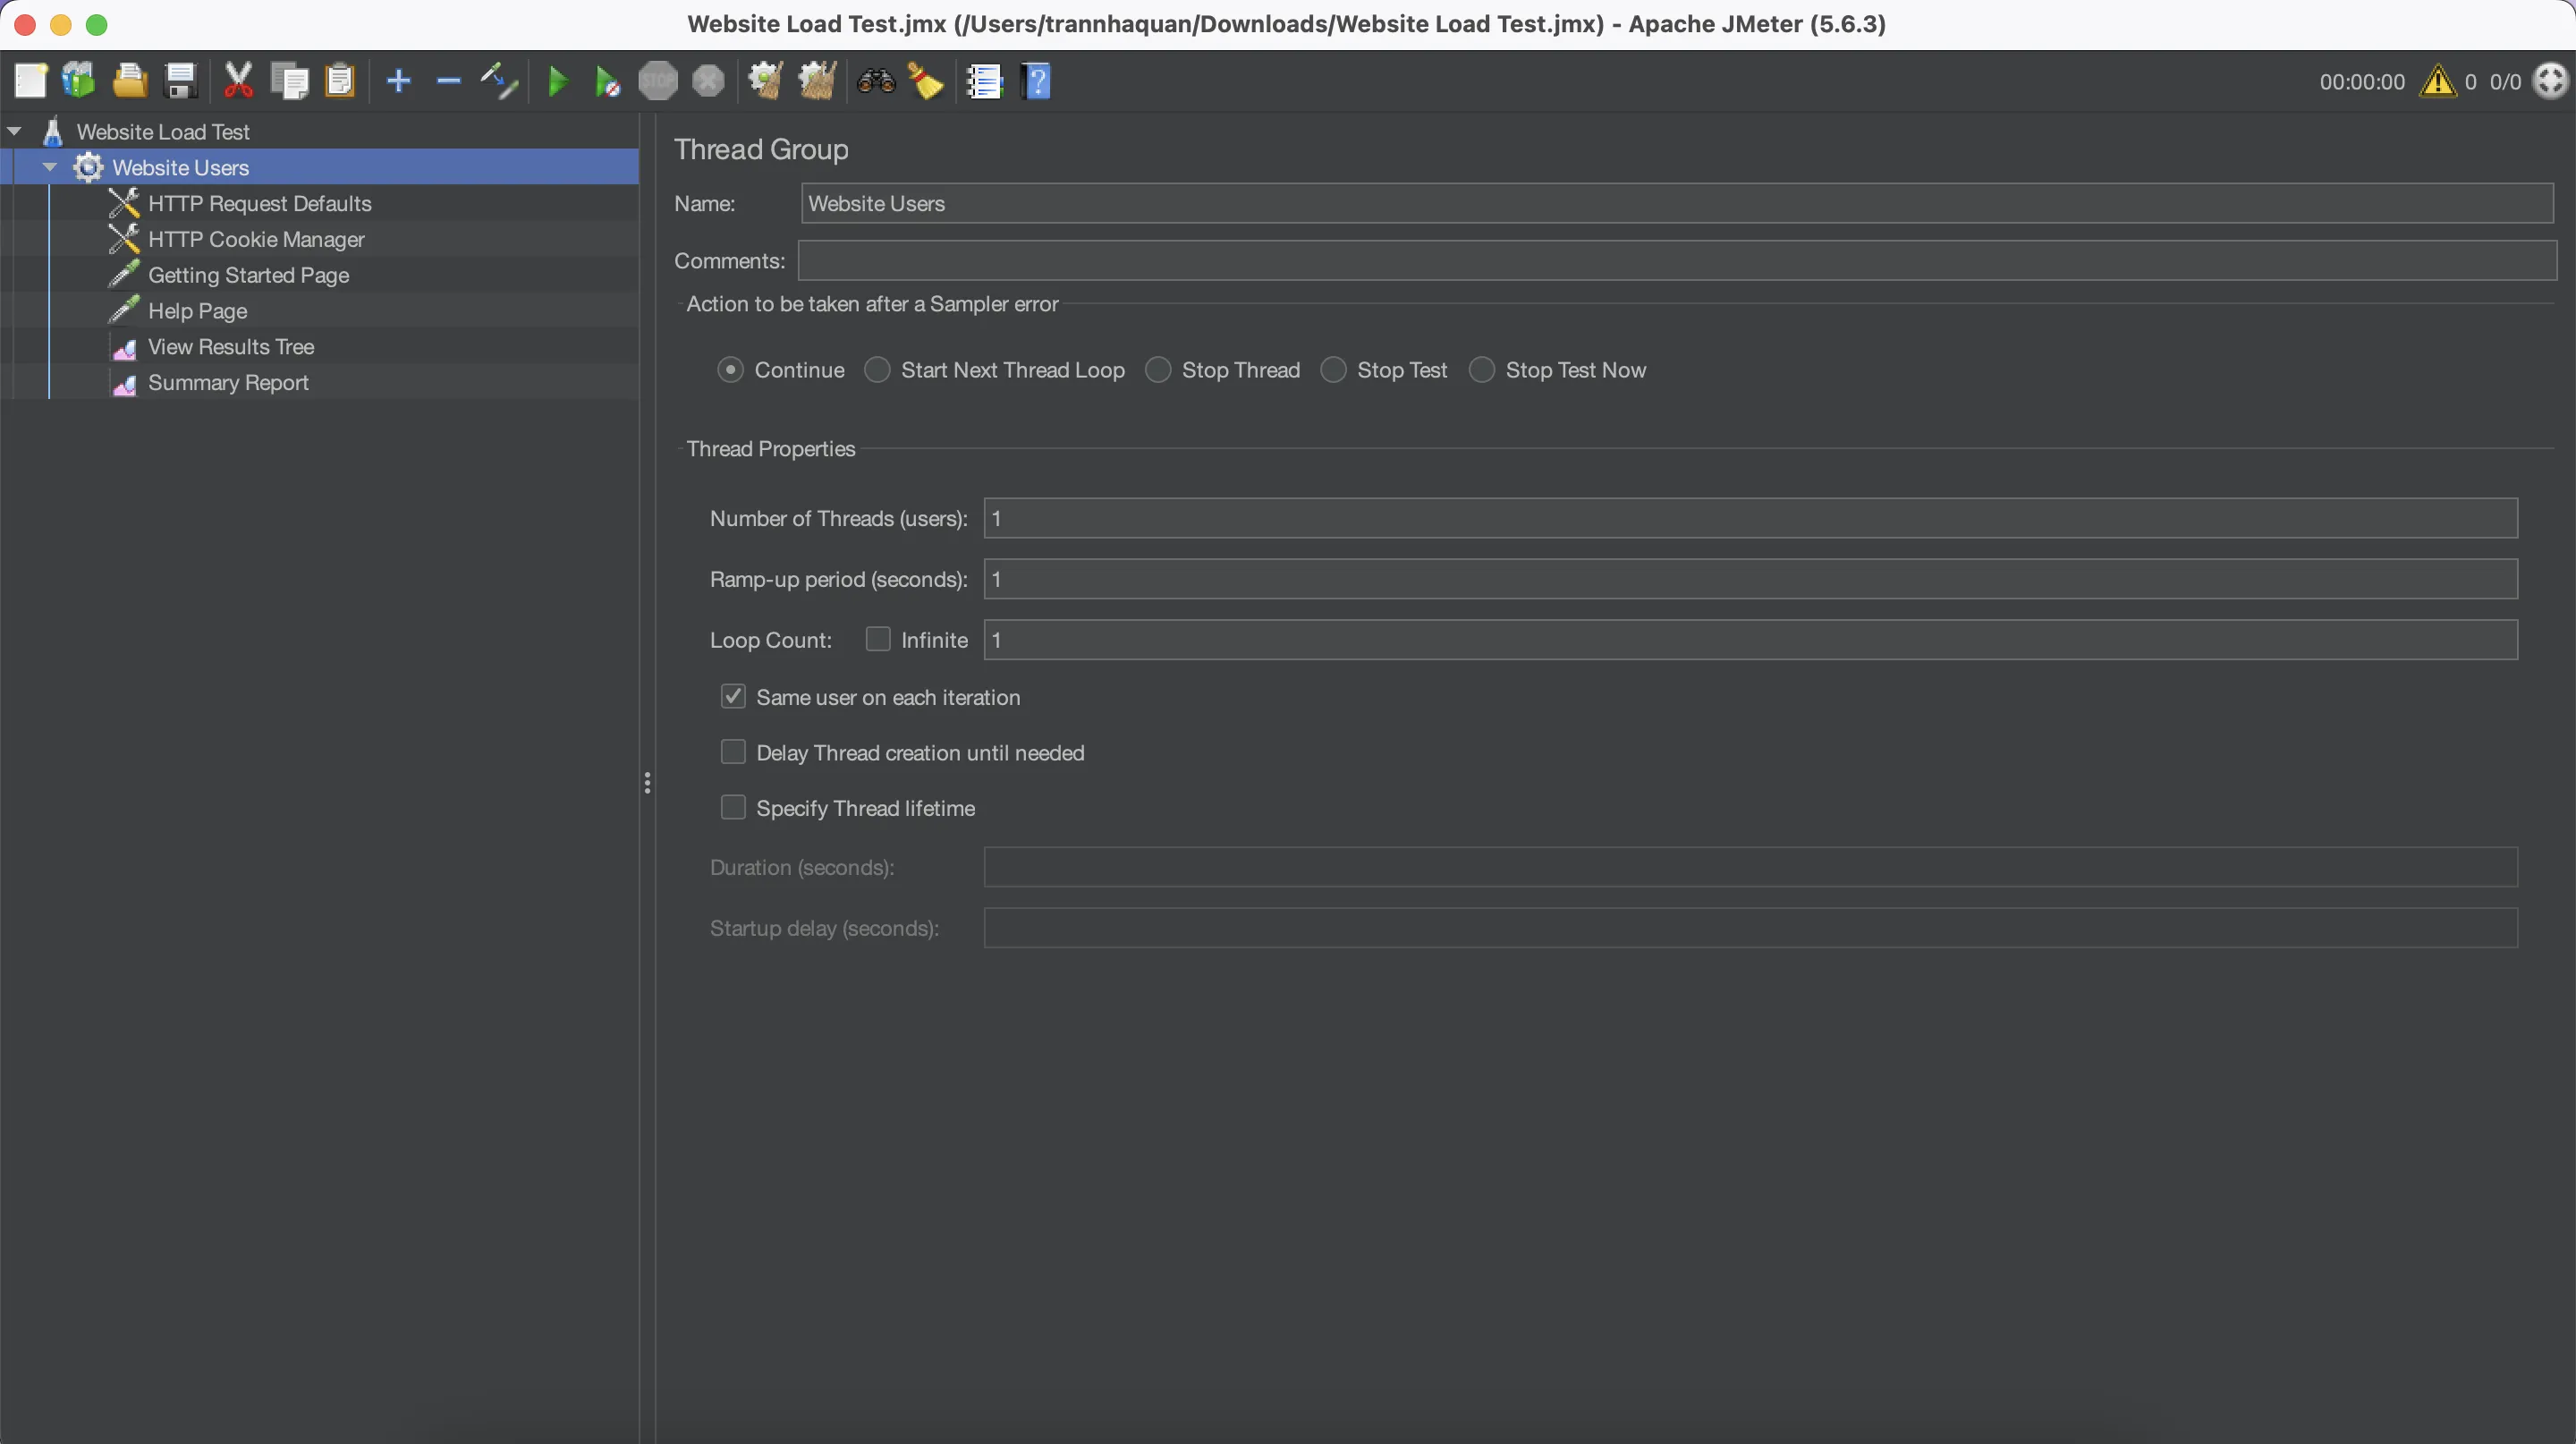
- Configure the Thread Group: Select the newly added "Thread Group".
- Name: "Website Users"
- Number of Threads (users):
50(Let's simulate 50 users) - Ramp-up period (seconds):
10(Start 5 users every second) - Loop Count:
1(Each user will perform the sequence once for now)
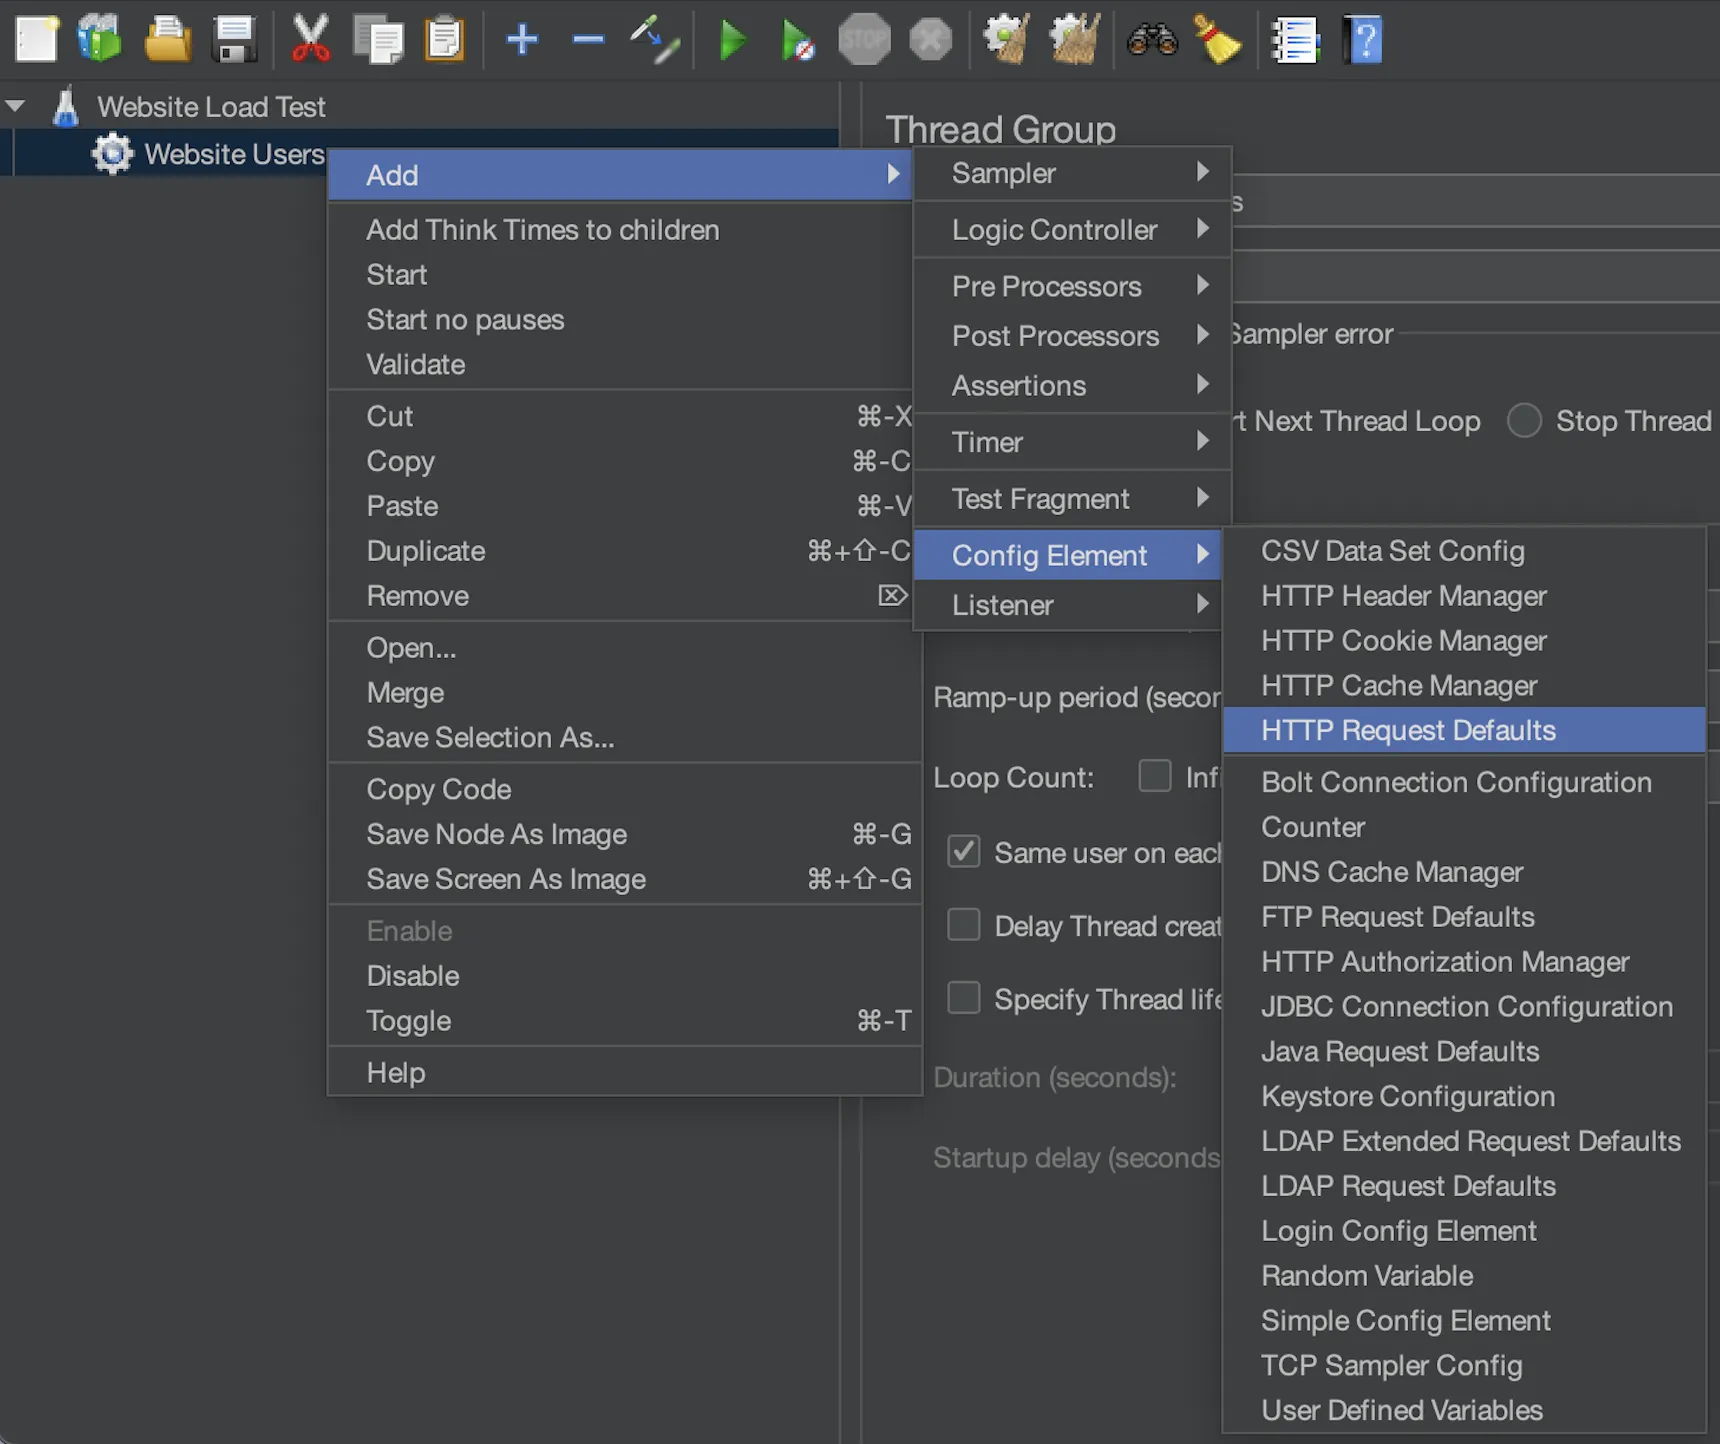
- Add HTTP Request Defaults (Good Practice): Right-click "Website Users" → Add → Config Element → HTTP Request Defaults.
- Select "HTTP Request Defaults".
- Server name or IP: Enter the domain you want to test (e.g.,
example.com). - This saves you from typing the domain for every HTTP request.
- Add an HTTP Cookie Manager (Essential for Web): Right-click "Website Users" → Add → Config Element → HTTP Cookie Manager.
- Leave settings as default. JMeter will now handle cookies automatically.
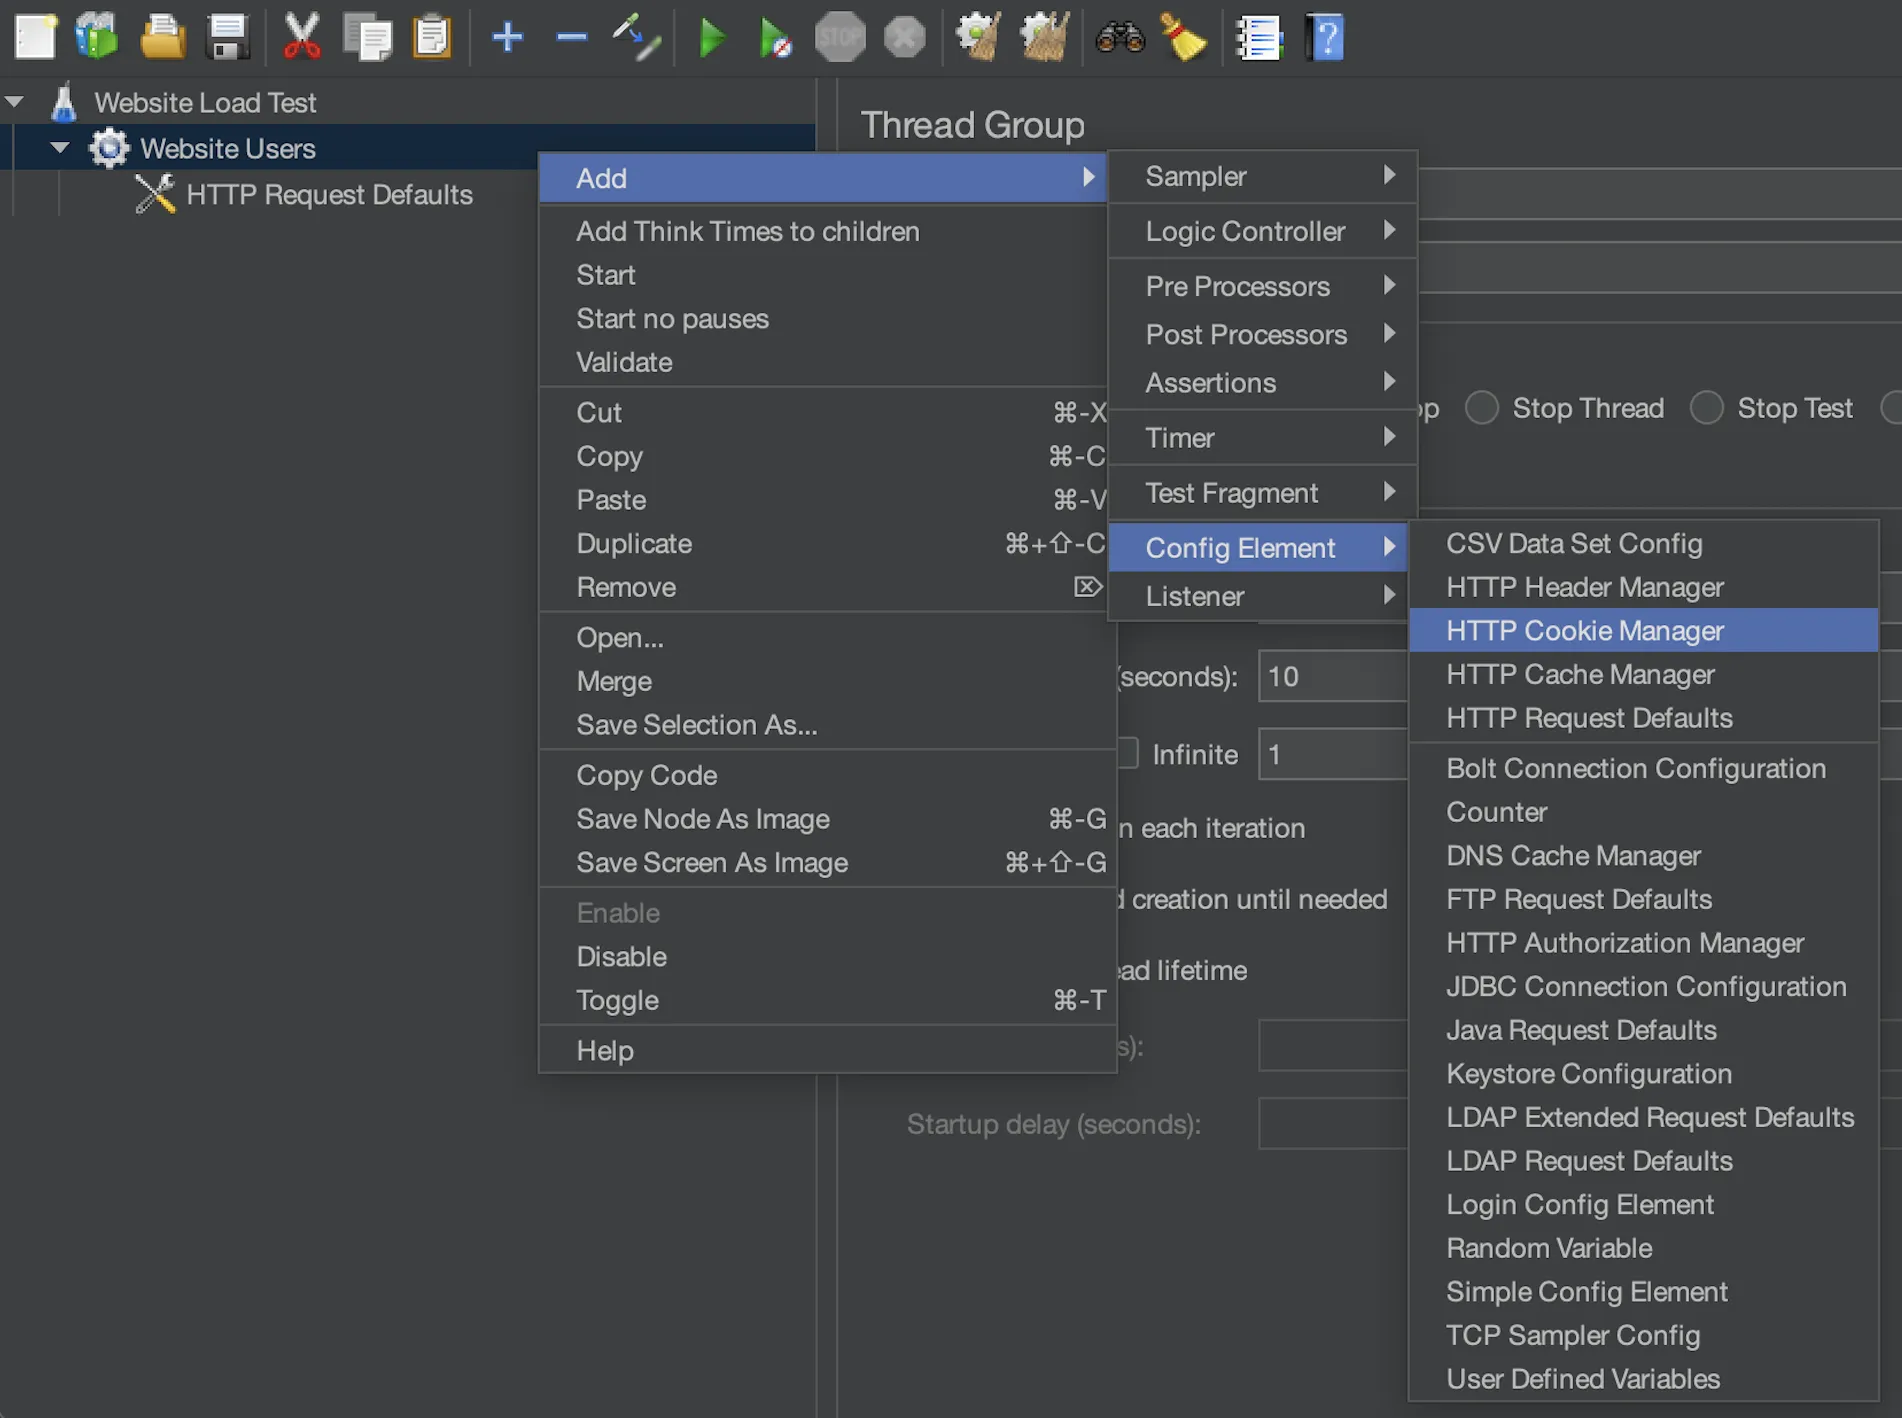
- Add Sampler 1 (Getting Started): Right-click "Website Users" → Add → Sampler → HTTP Request.
- Name: "Getting Started Page"
- Path:
/(Since we set the domain in HTTP Request Defaults) - Method:
GET(Default)
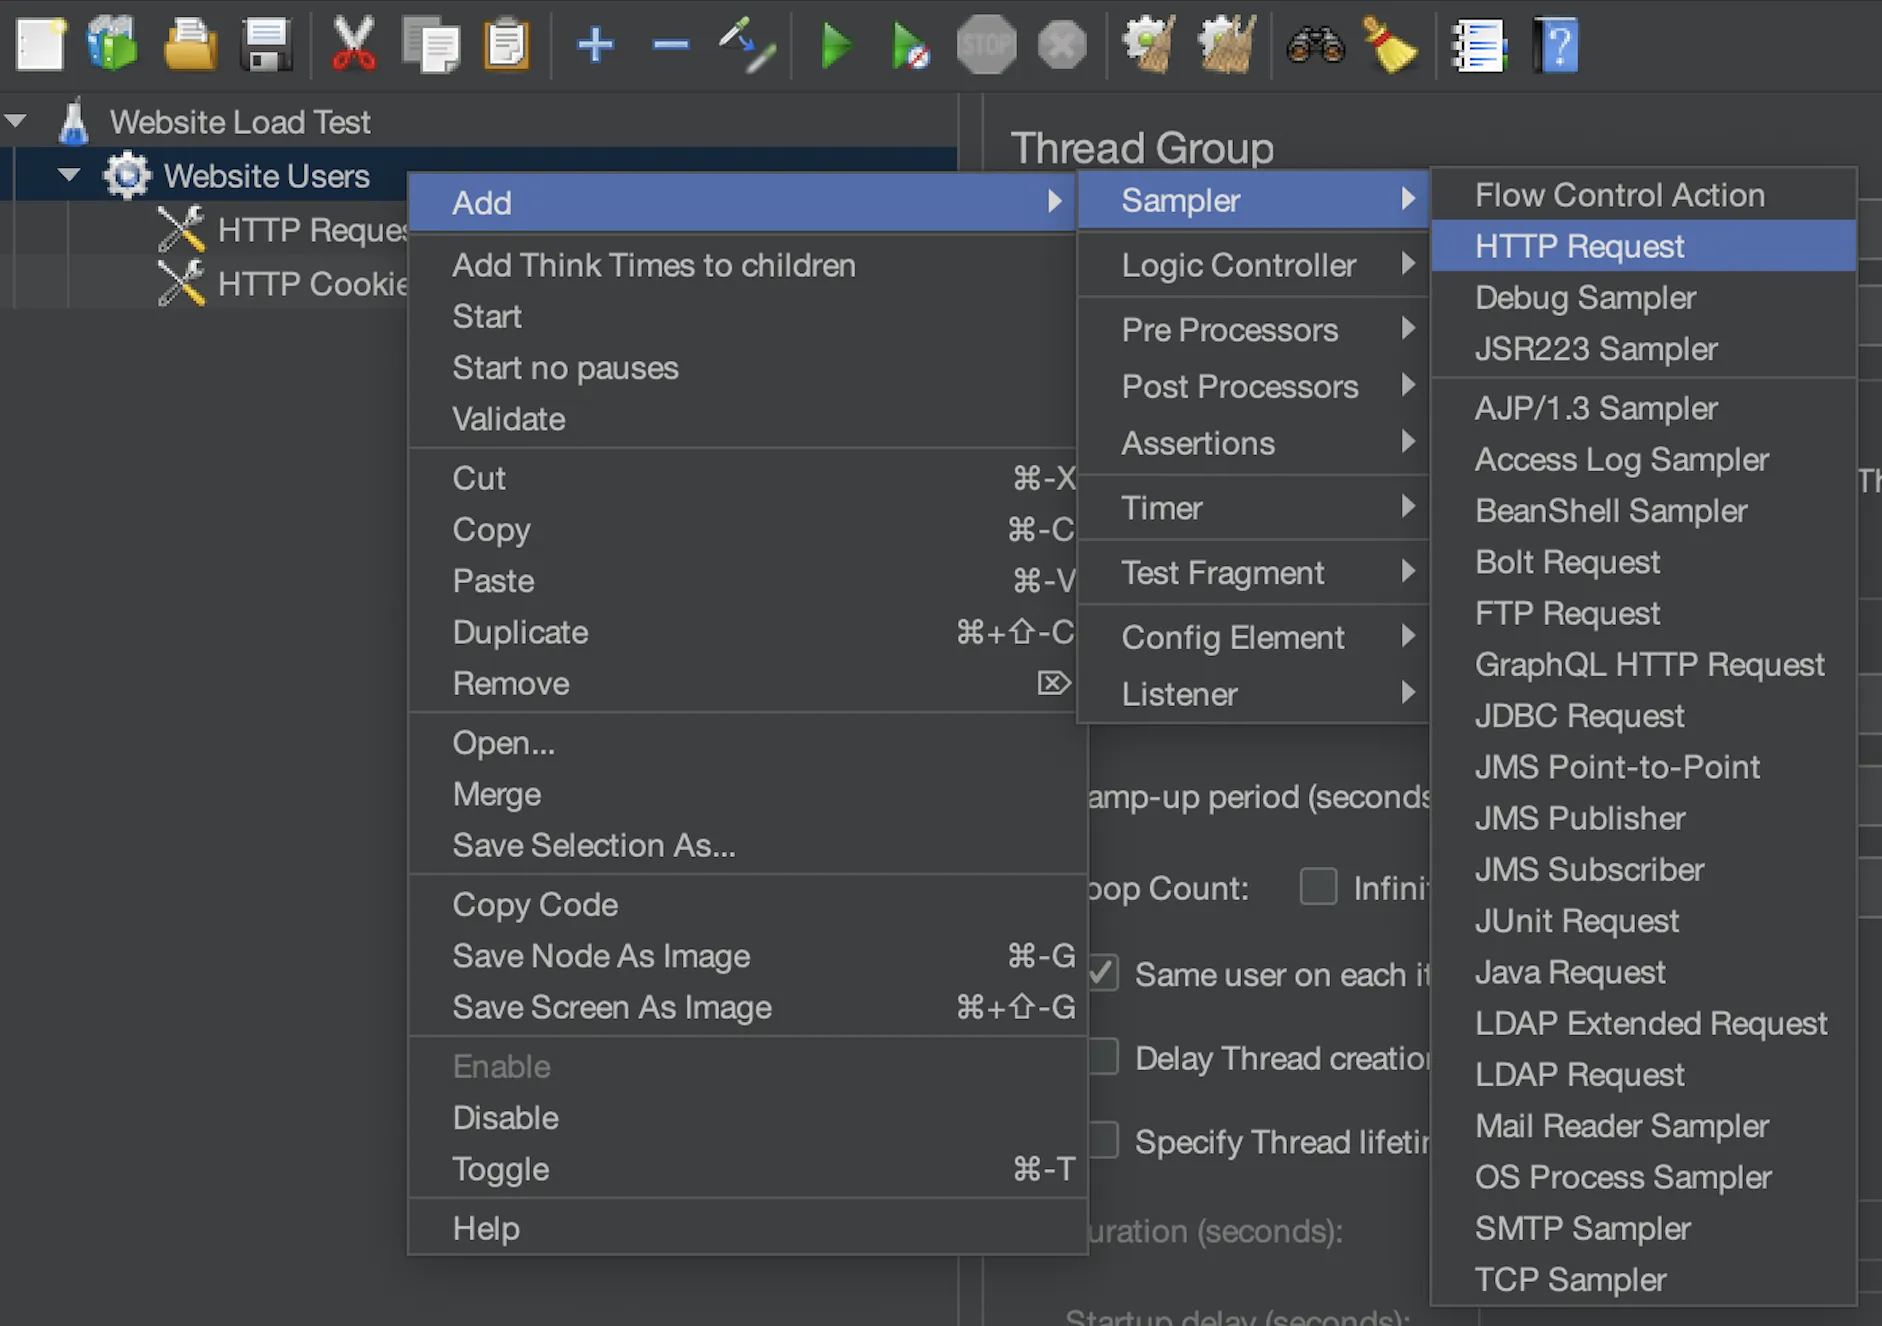
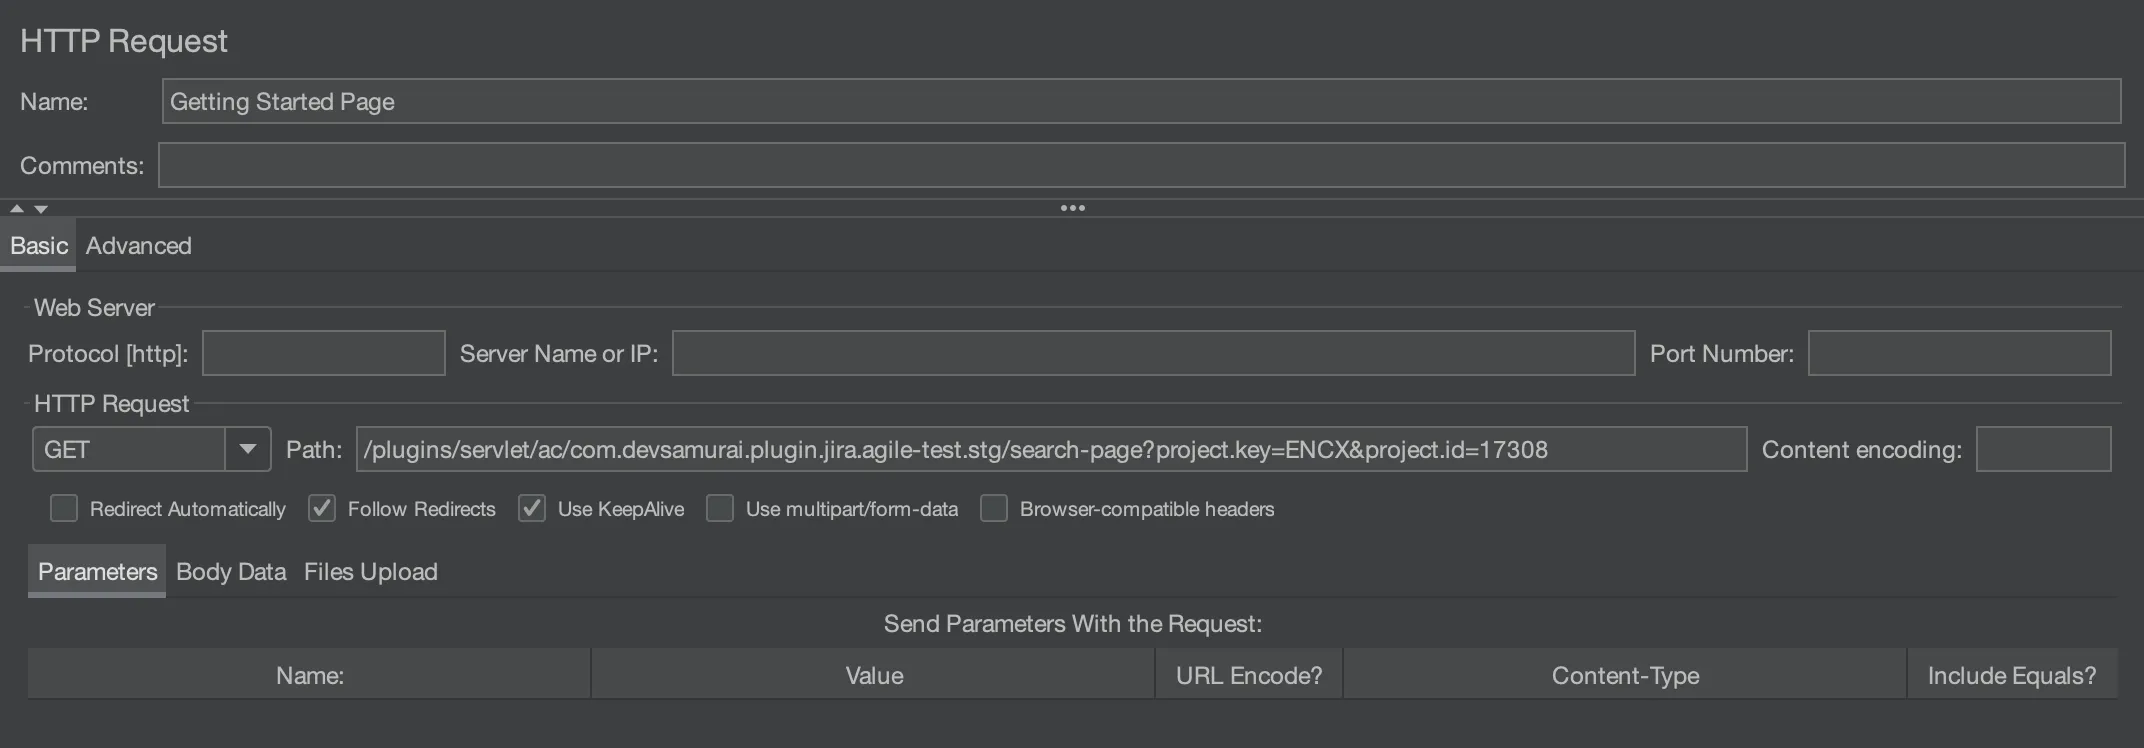
- Add Sampler 2 ("Help" Page): Right-click "Website Users" → Add → Sampler → HTTP Request.
- Name: "Help Page"
- Path:
/about/(Or whatever the path is on your target site) - Method:
GET
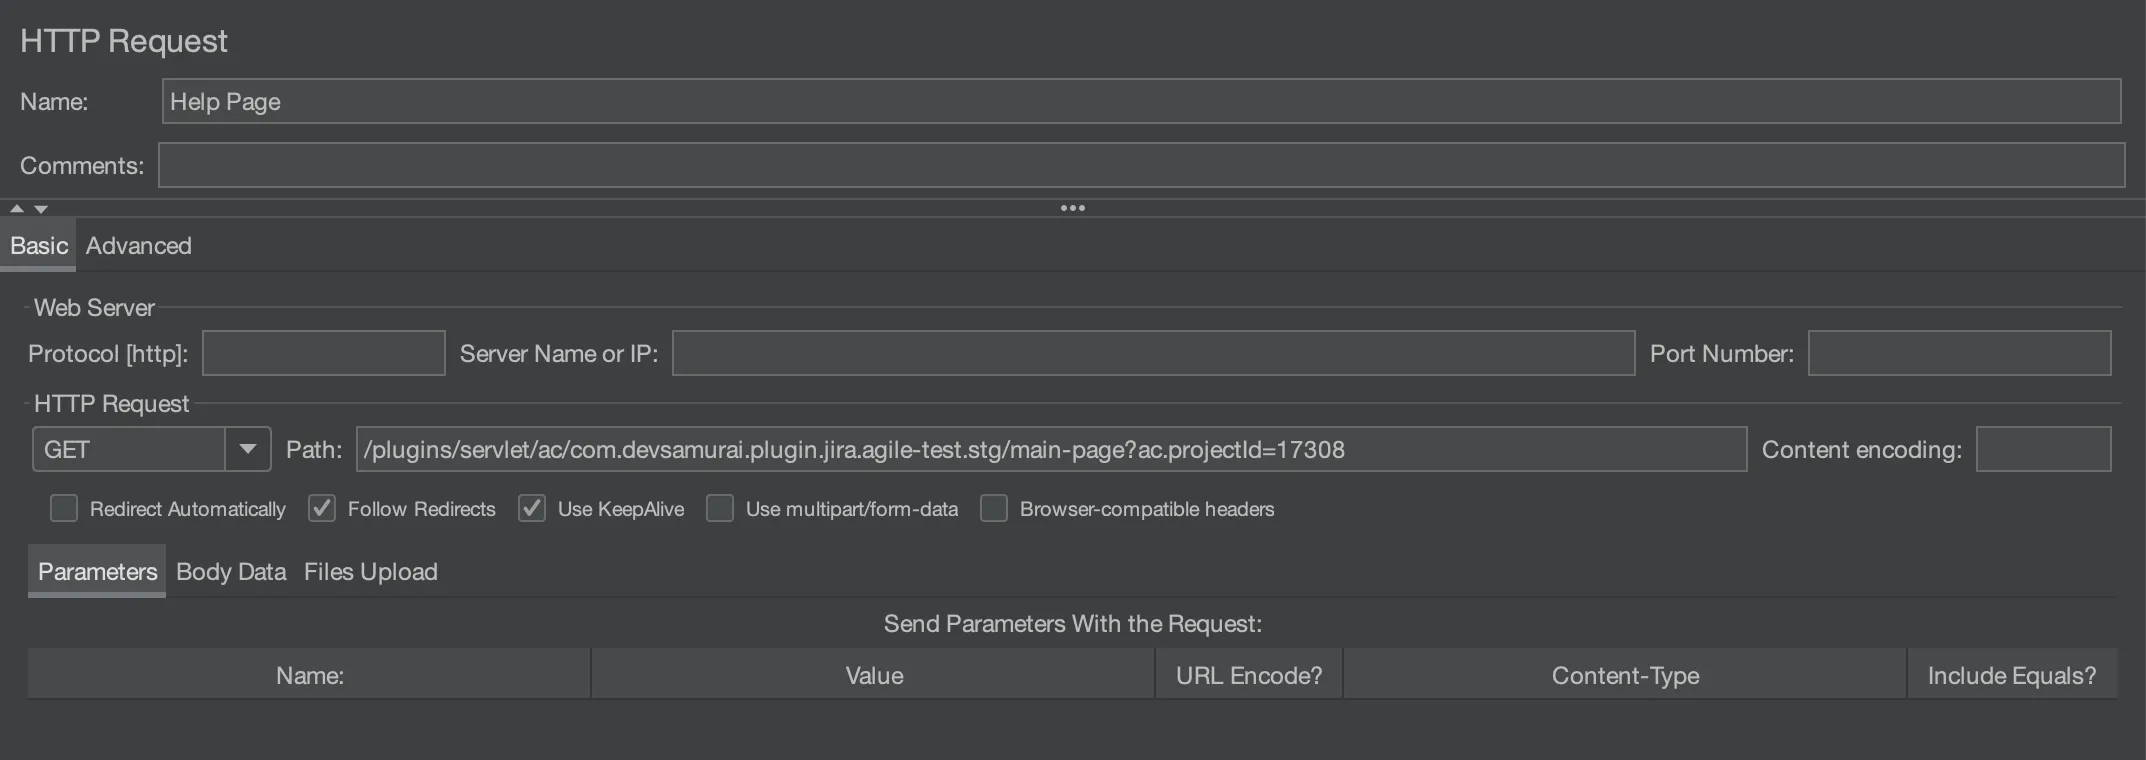
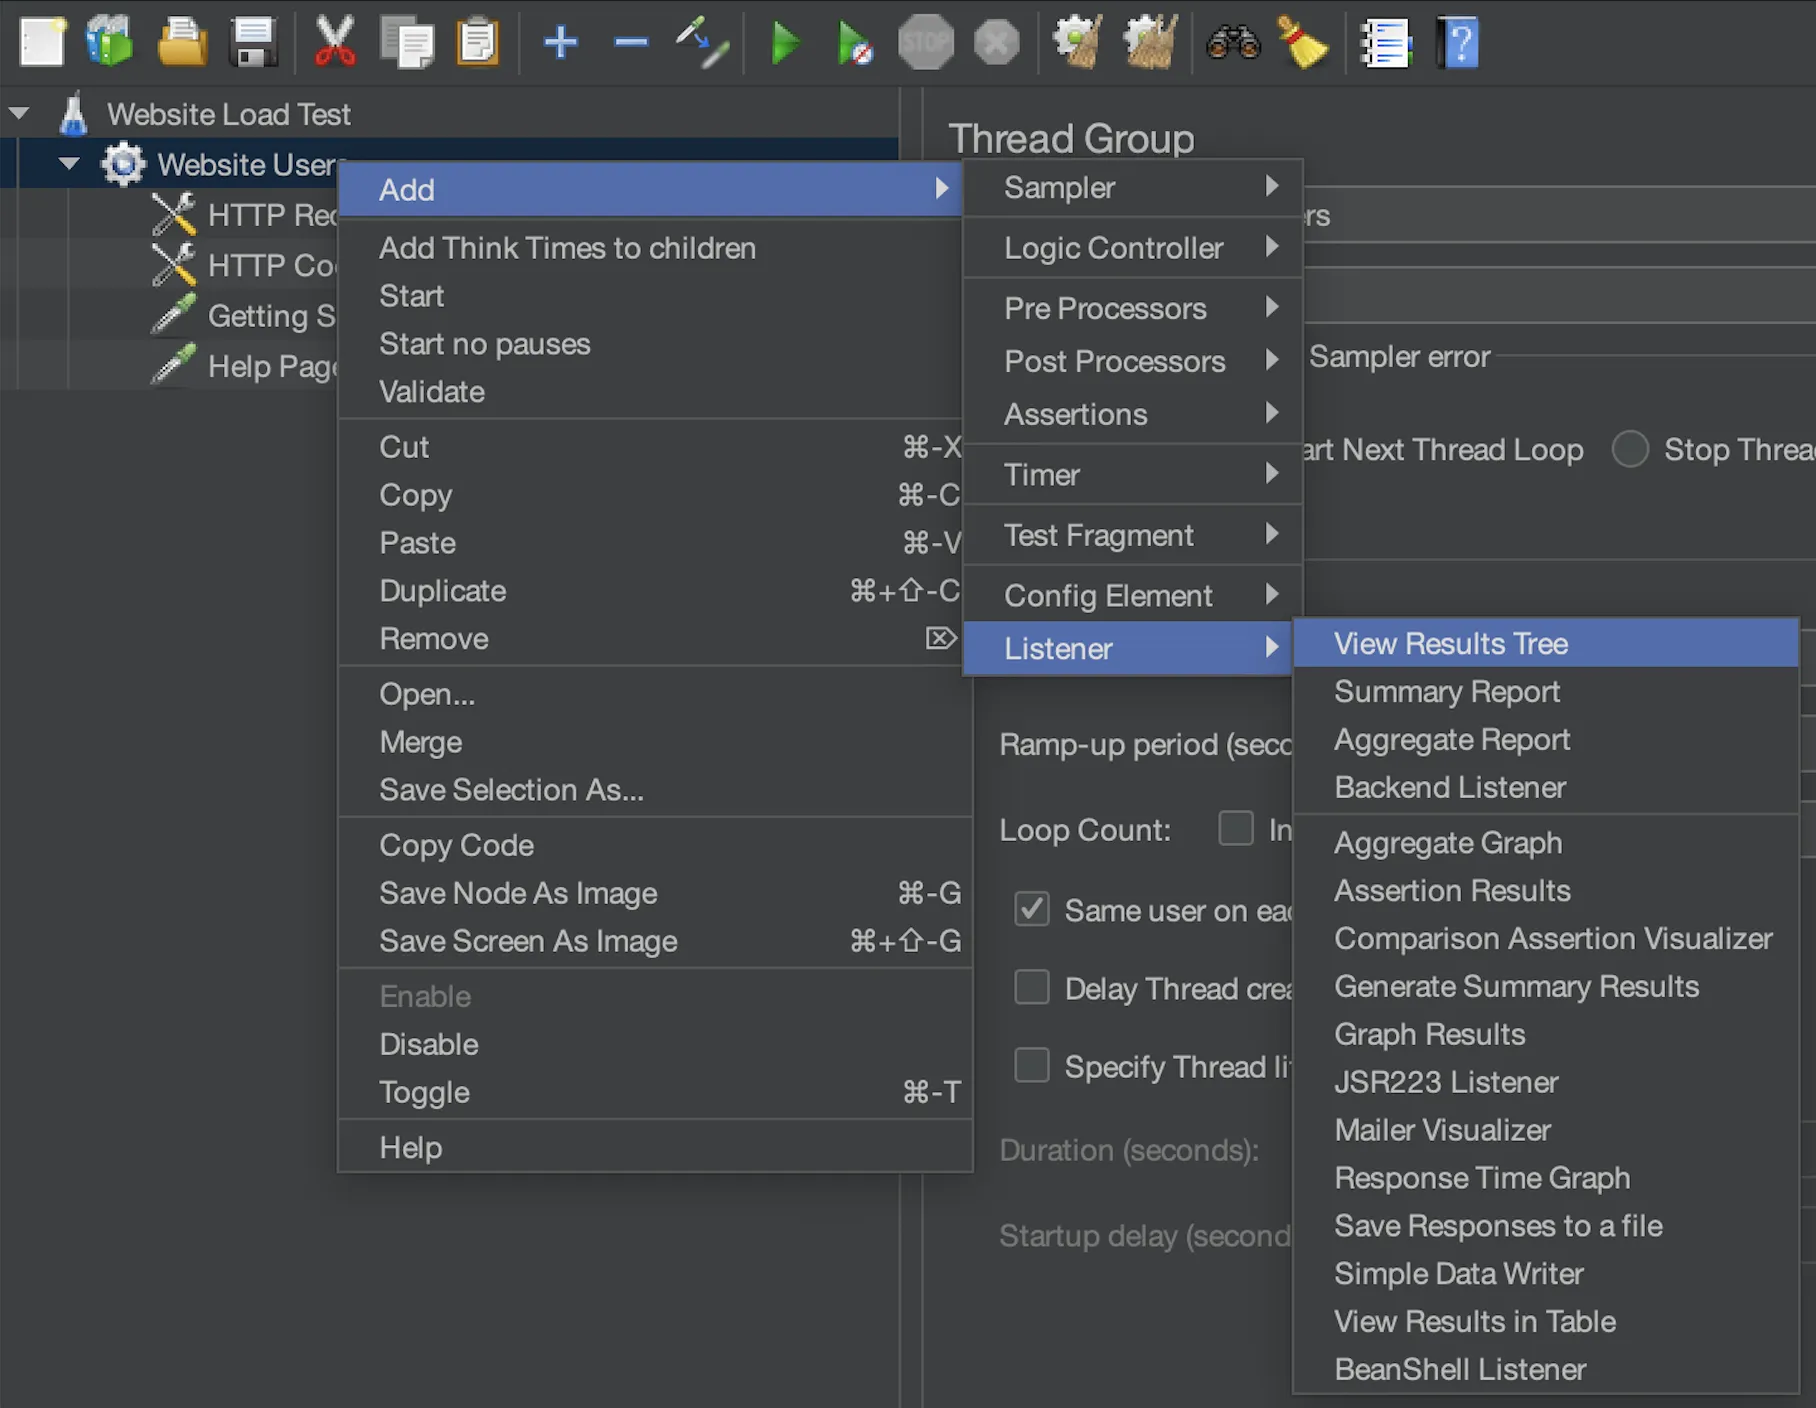
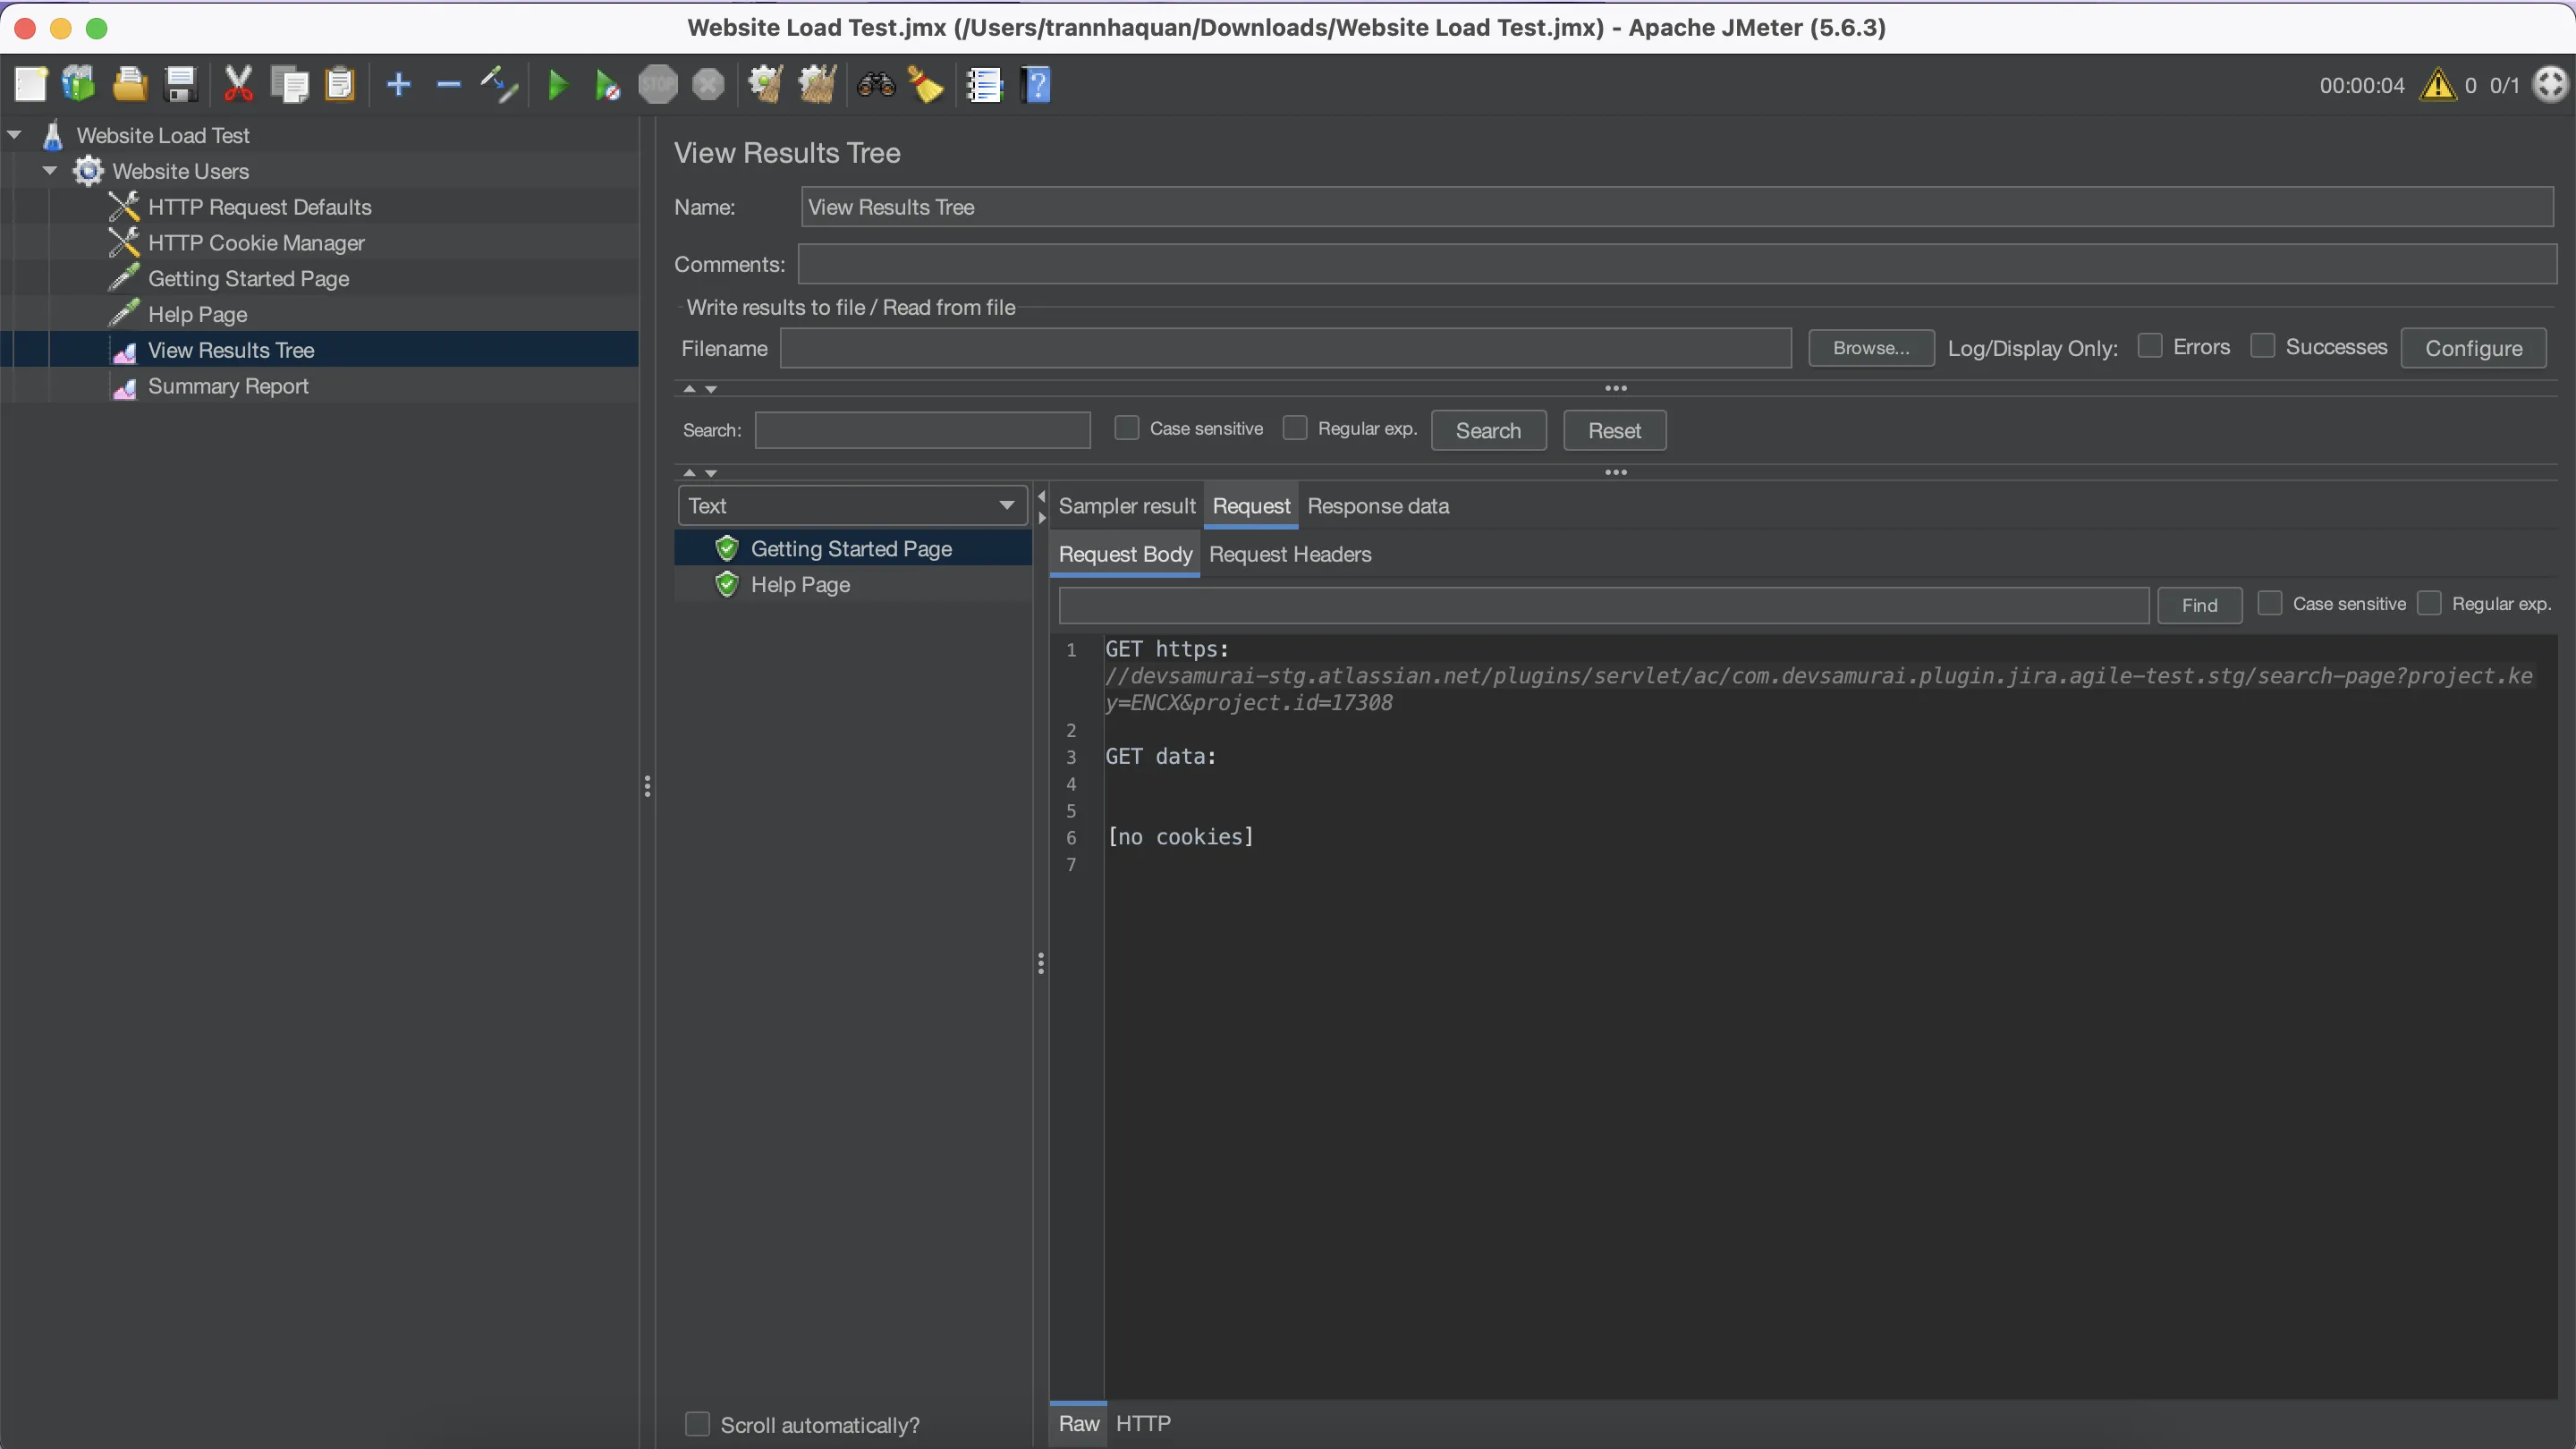
- Add a Listener (for Debugging): Right-click "Website Users" → Add → Listener → View Results Tree.
- We'll use this to see individual requests when running with few users.
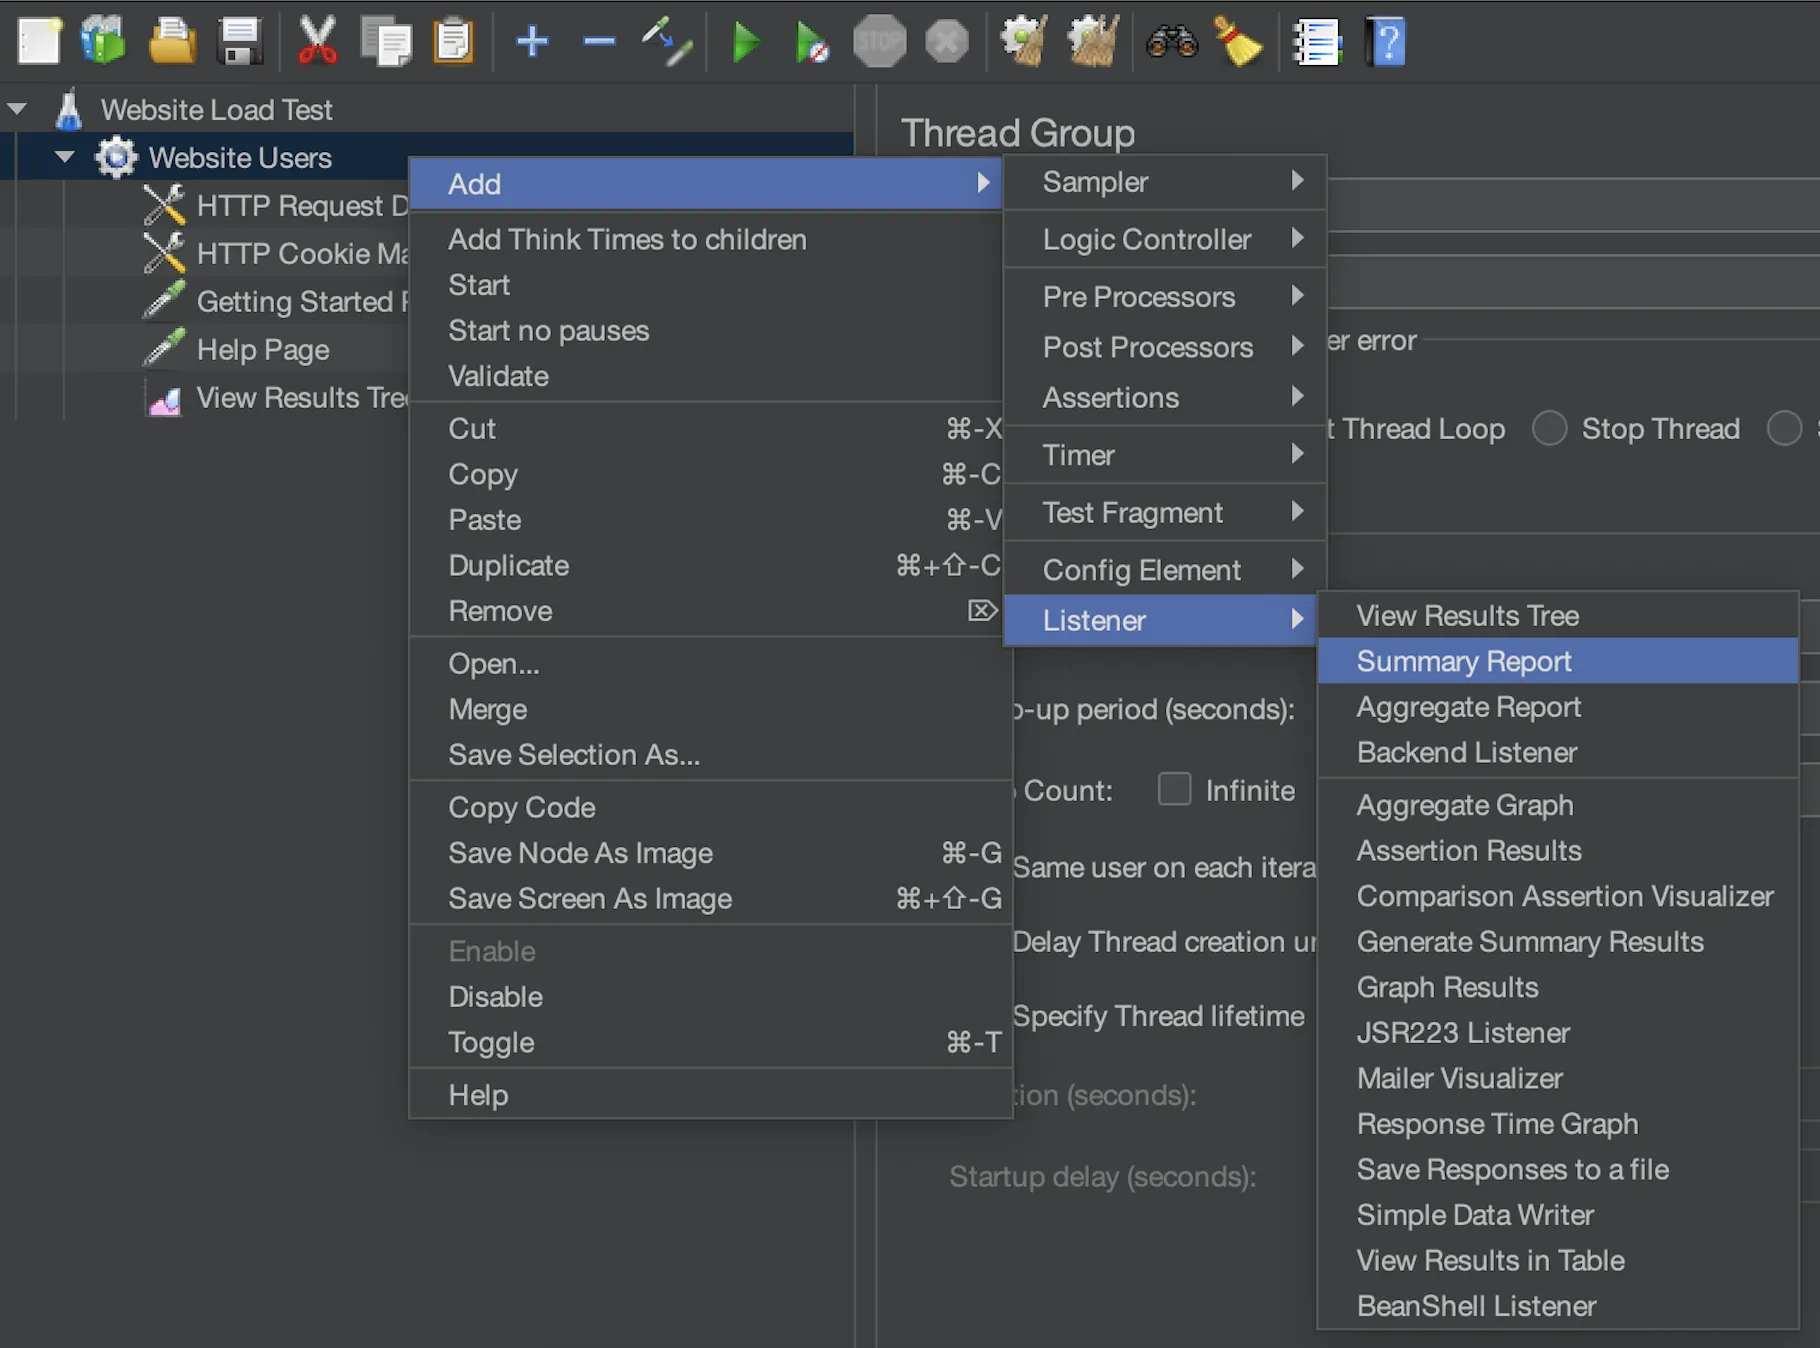
- Add a Listener (for Analysis): Right-click "Website Users" → Add → Listener → Summary Report.
- This will give us the key metrics.
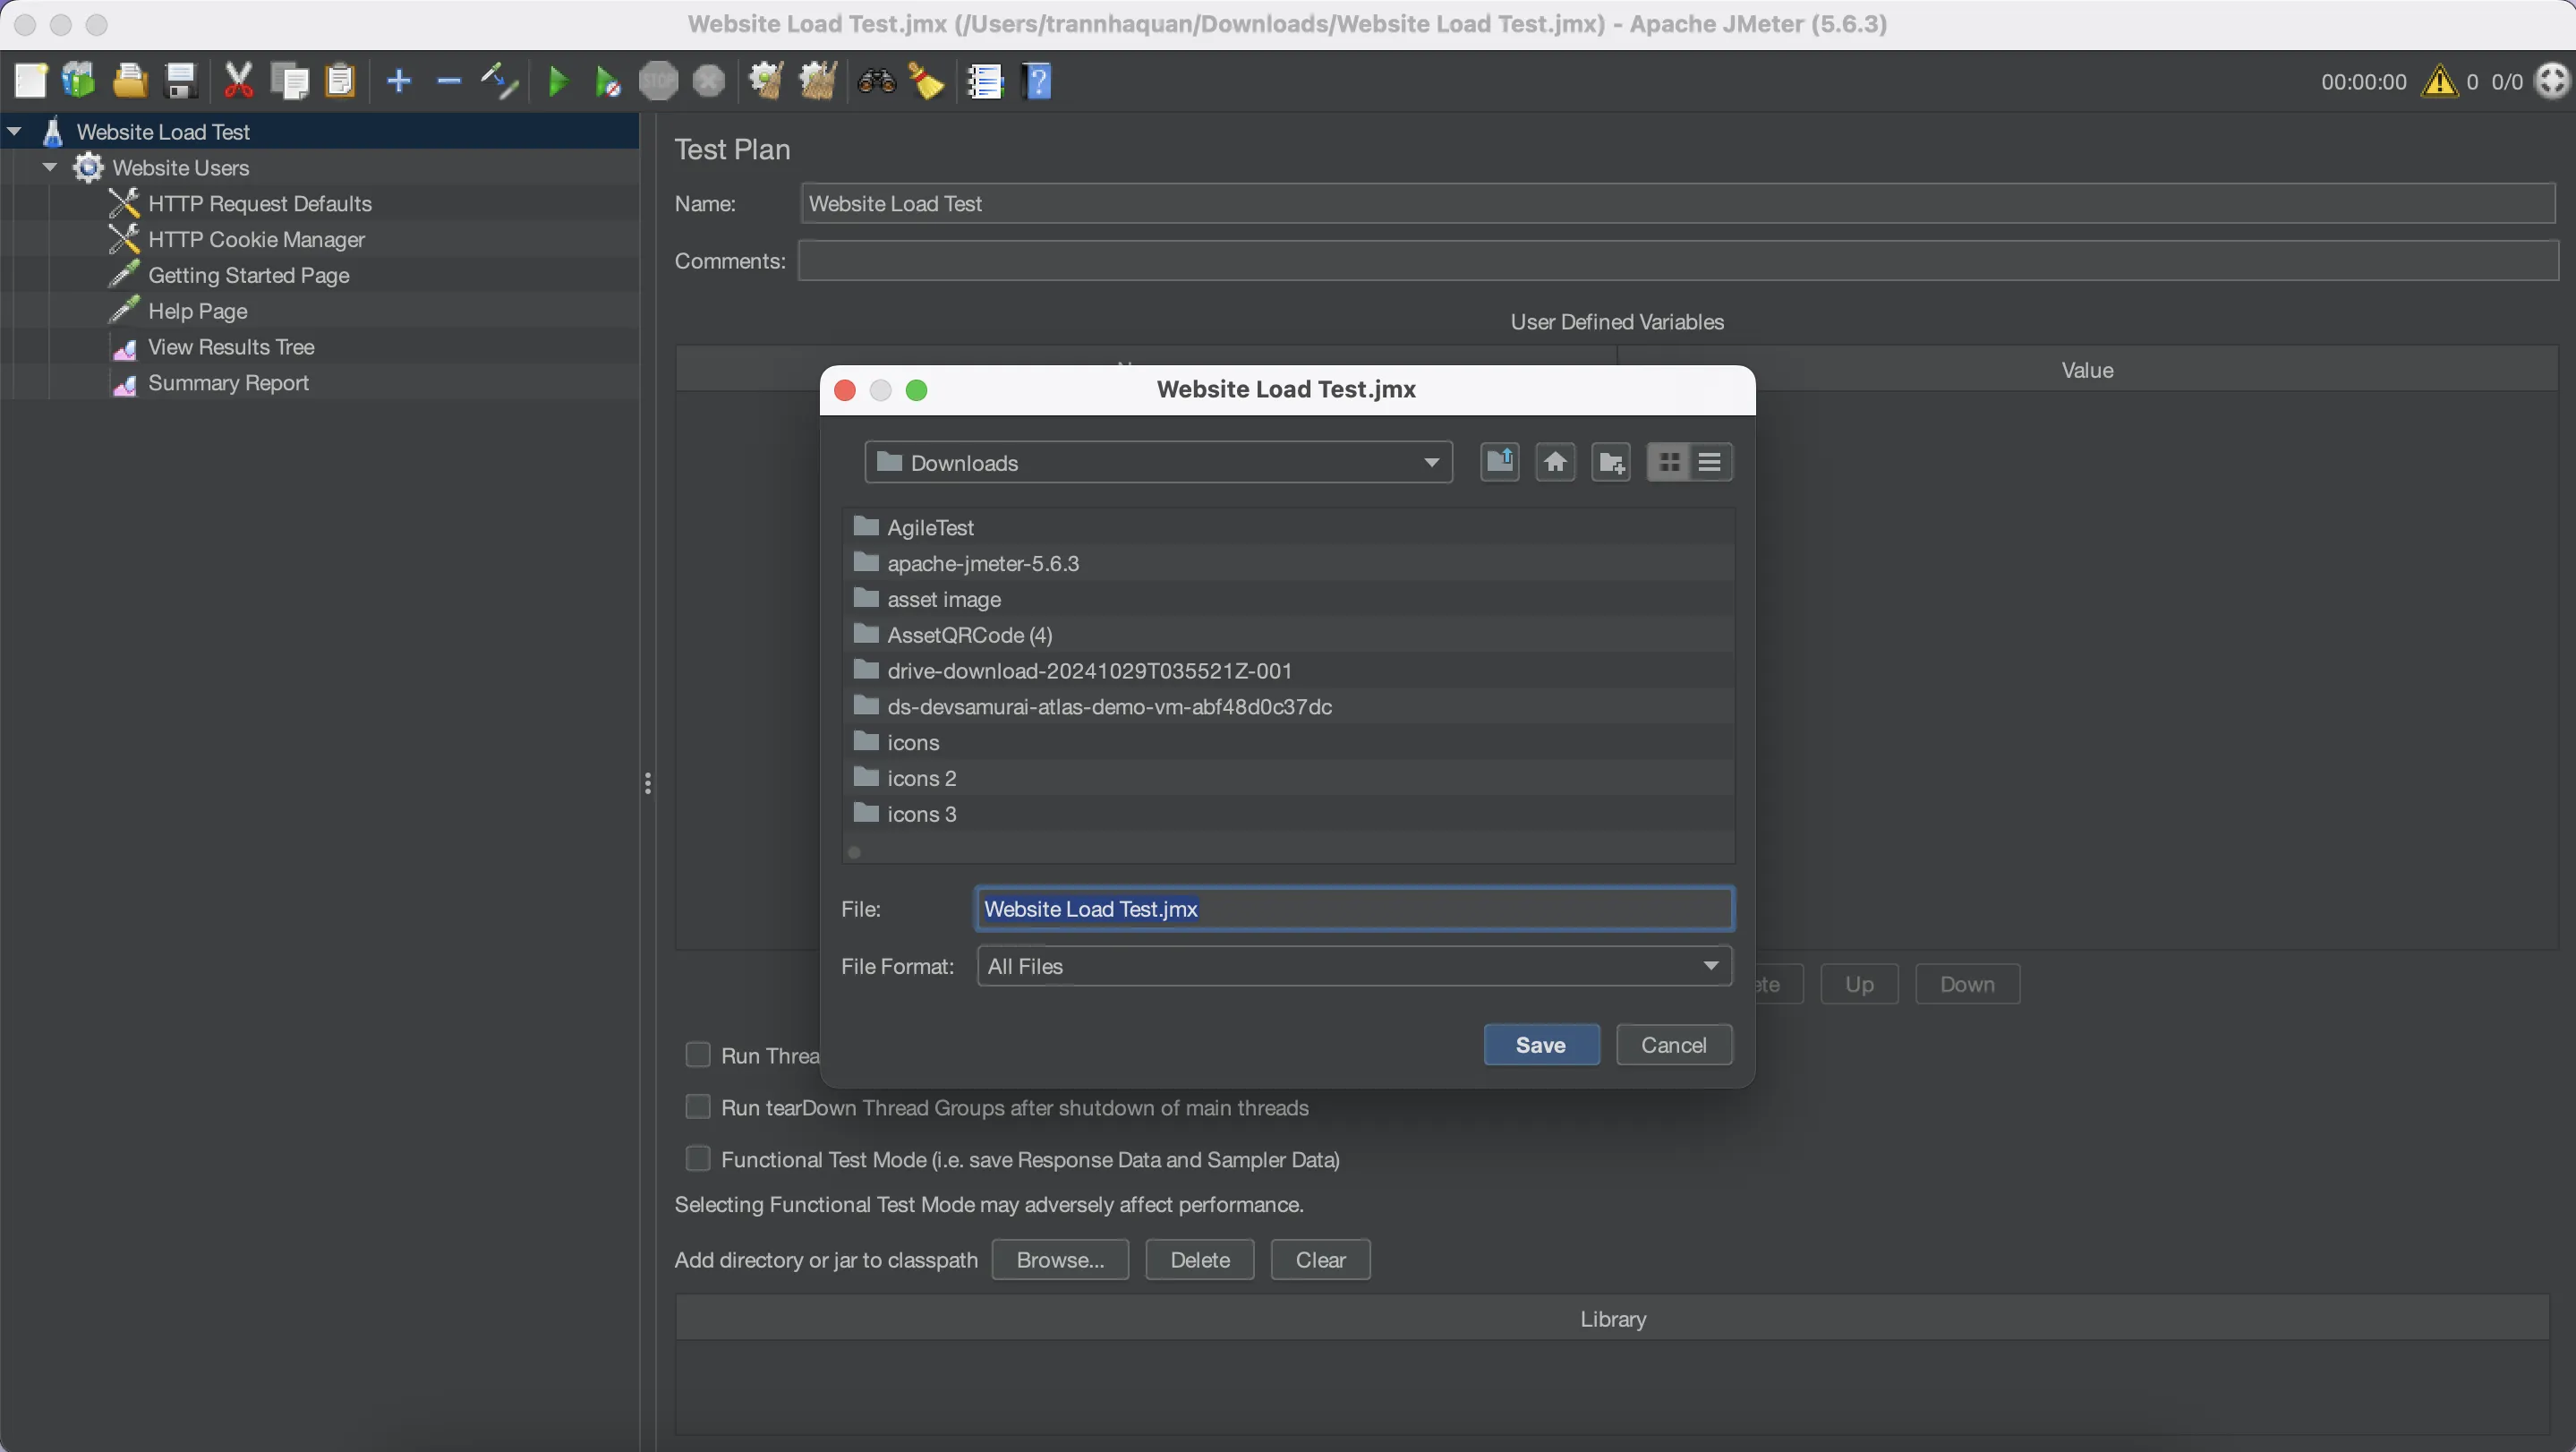
- Save Your Test Plan: Click File → Save. Save it somewhere you'll find it (e.g.,
website_load_test.jmx).
- Run a Small Test (for Debugging): Before unleashing 50 users, change the Thread Group to 1 user, 1-second ramp-up, 1 loop.
- Clear Previous Results: Click the "Clear All" button (the broom icon).

- Run: Click the "Start" button (the green play icon).

- Debug: Watch the "View Results Tree". Click on requests. Are they succeeding (Green shield/text)? What's in the Request/Response? If there are errors (Red shield/text), investigate the response details.
-
Ready for Load: Once the 1-user test works, change the Thread Group back to
50users,10seconds ramp-up,1loop. -
Clear Results Again! (Important!)
-
Run: Click "Start". Watch the Summary Report populate.

Humor Break: Running your first load test feels a bit like opening the floodgates. Hope your server is wearing its raincoat!
Analyzing the Results: What Do These Numbers Mean?
When reviewing your test results, the Summary Report (or Aggregate Report, which is similar but groups requests slightly differently) is a key tool.

Here's what the main columns mean:
- # Samples: Total number of requests sent for that sampler.
- Average: The average time (in milliseconds) it took to get a response. Lower is better!
- Median: The midpoint response time - 50% of the requests were faster than this value.
- 90% Line / 95% Line: Crucial indicators! They show the response time under which 90% or 95% of requests were completed. These values offer a better picture of user experience under load than the average.
- Min / Max: The fastest and slowest response times recorded.
- Error %: Percentage of requests that failed (e.g., non-2xx status codes or assertion failures). Ideally, this should be 0%.
- Throughput: Number of requests handled per second - a measure of how many hits the server can process in a given time. Higher is better, but only if response times and error rates stay low.
Tester's Insight: Don’t rely solely on the average! High percentile values (90%, 95%) and the error rate often reveal performance issues more clearly. A low average can be misleading - if 10% of your users are experiencing long delays, you’ve still got a problem.
Beyond the Basics: Stepping Up Your JMeter Game
Once you're comfortable with the fundamentals, explore these intermediate concepts:
- Parameterization (CSV Data Set Config): Don't try to log in with the exact same user details 50 times! Use the CSV Data Set Config tool to read different login names, search words, or other information from a file. This way, each virtual user uses unique data.
- Correlation: This is often the most complicated part when testing complex web apps. Many apps use dynamic data (like session IDs, unique tokens, or view state variables) in subsequent requests that were returned in previous responses. You need to "extract" this dynamic data from a response (using Regular Expression Extractor or JSON Extractor) and "inject" it into later requests. It's like needing a secret code from Message #1 to open Message #2.
- Timers: Add pauses between requests (e.g., Constant Timer, Gaussian Random Timer) to simulate more realistic user think time. Users don't usually hammer buttons relentlessly; they pause to read, fill out forms, etc.
Running Load Tests Properly: Non-GUI Mode
Remember how we said running big tests in the GUI isn't great? Here's how to run from the command line:
-
Open your terminal or command prompt.
-
Navigate to the
bindirectory of your JMeter installation. -
Use the following command:Bash
-n: Non-GUI mode-t: Path to your.jmxtest plan file.-l: Path where the results.jtlfile will be saved. This file contains all the raw results.-e -o: Generate an HTML Dashboard report from the.jtlfile after the test runs. Specify an empty directory for the dashboard output.

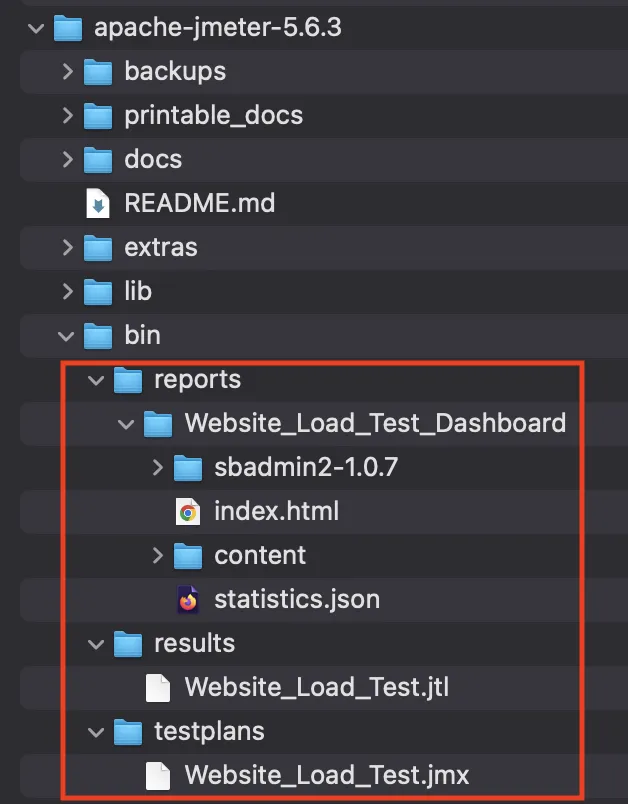
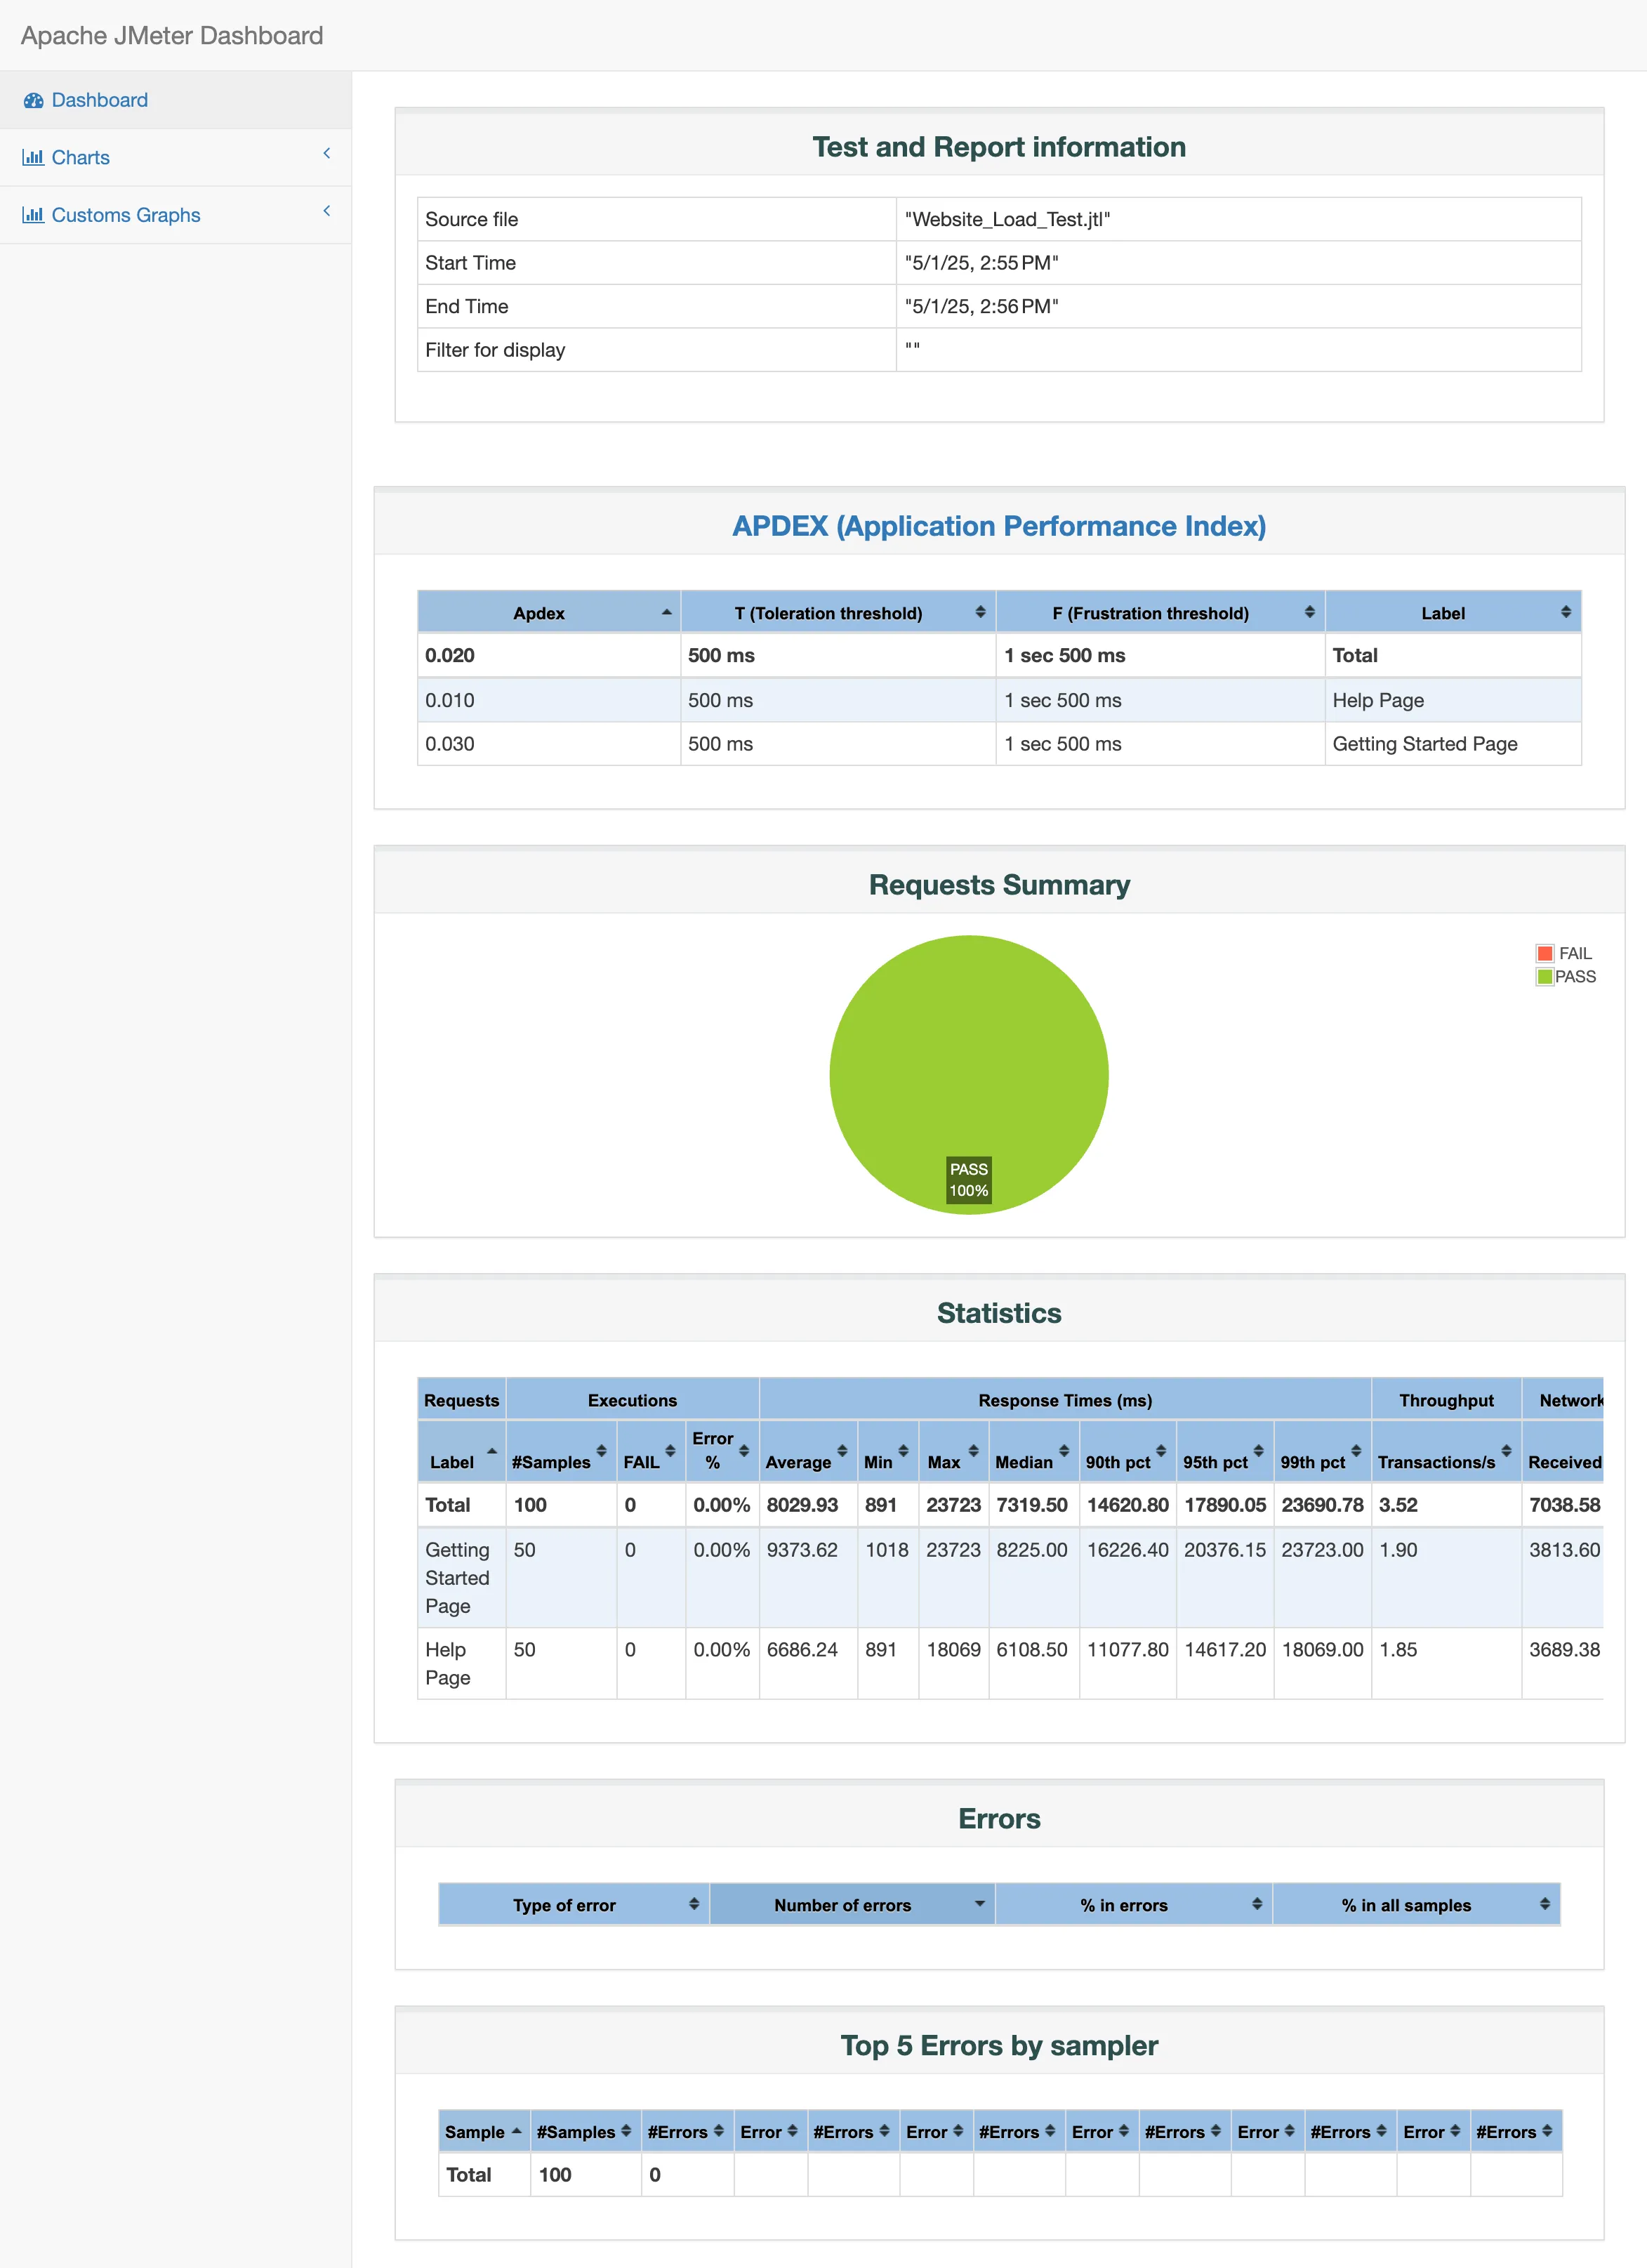
This is the standard way to execute performance tests and get reliable results without the GUI interfering.
Pro Tip: Running tests from a separate "load generator" machine (or multiple machines in a distributed setup) is even better, as it isolates the test execution from the machine running the application under test.
Tips from Your Companion
- Start Small: Don't jump to 1000 users immediately. Start with 1 user to debug your script, then maybe 10, then 50, then 100, and scale up gradually while monitoring both JMeter's results and the application's server-side metrics.
- Monitor the Server: JMeter tells you the client-side experience (response times, errors). To truly understand performance, you must also monitor the application servers, database, etc. (CPU, memory, network, disk I/O). Correlate JMeter results with server resource usage.
- Understand Your Goal: Are you testing for breaking point (Stress)? Expected peak load (Load)? Stability over time (Endurance)? Your test design should match the objective.
- Correlation is King (and sometimes Painful): Be prepared to spend time figuring out dynamic data if your app uses it heavily. Use the View Results Tree listener and the Debug Sampler/PostProcessors to see what data is available in responses.
- Don't Overlook Assertions: A fast error is still an error. Make sure your assertions verify that the correct response is returned under load.
- Use the Community: JMeter has a large and active community. If you get stuck, chances are someone has faced a similar problem. Search online forums and documentation.
Conclusion: You Are Now a Performance Testing Initiate!
Wow! You've just taken your first significant steps into the world of performance testing with Apache JMeter. You've learned the why, the what, and the basic how-to. You can build a simple load test, run it, and understand the key metrics.
JMeter is a powerful tool with plenty more to explore—like correlation, advanced controllers, distributed testing, and CI/CD integration. But with the basics under your belt, you’re ready to start diving into the broader world of testing tools and platforms, including options like LeanTest.
Performance testing isn't just a technical task; it's about ensuring your users have a great experience and your application can handle success! With JMeter in your toolkit, you're empowered to find performance bottlenecks before they impact your users and your business.
So, go forth! Download JMeter, build that first test plan, unleash your first (small!) digital stampede, and start making your application perform like the star it's meant to be!
Happy load testing!
